Scottish vs Pima Child Poverty Under the Age of 5
COMPARE
Scottish
Pima
Child Poverty Under the Age of 5
Child Poverty Under the Age of 5 Comparison
Scottish
Pima
16.9%
CHILD POVERTY UNDER THE AGE OF 5
68.6/ 100
METRIC RATING
163rd/ 347
METRIC RANK
27.4%
CHILD POVERTY UNDER THE AGE OF 5
0.0/ 100
METRIC RATING
337th/ 347
METRIC RANK
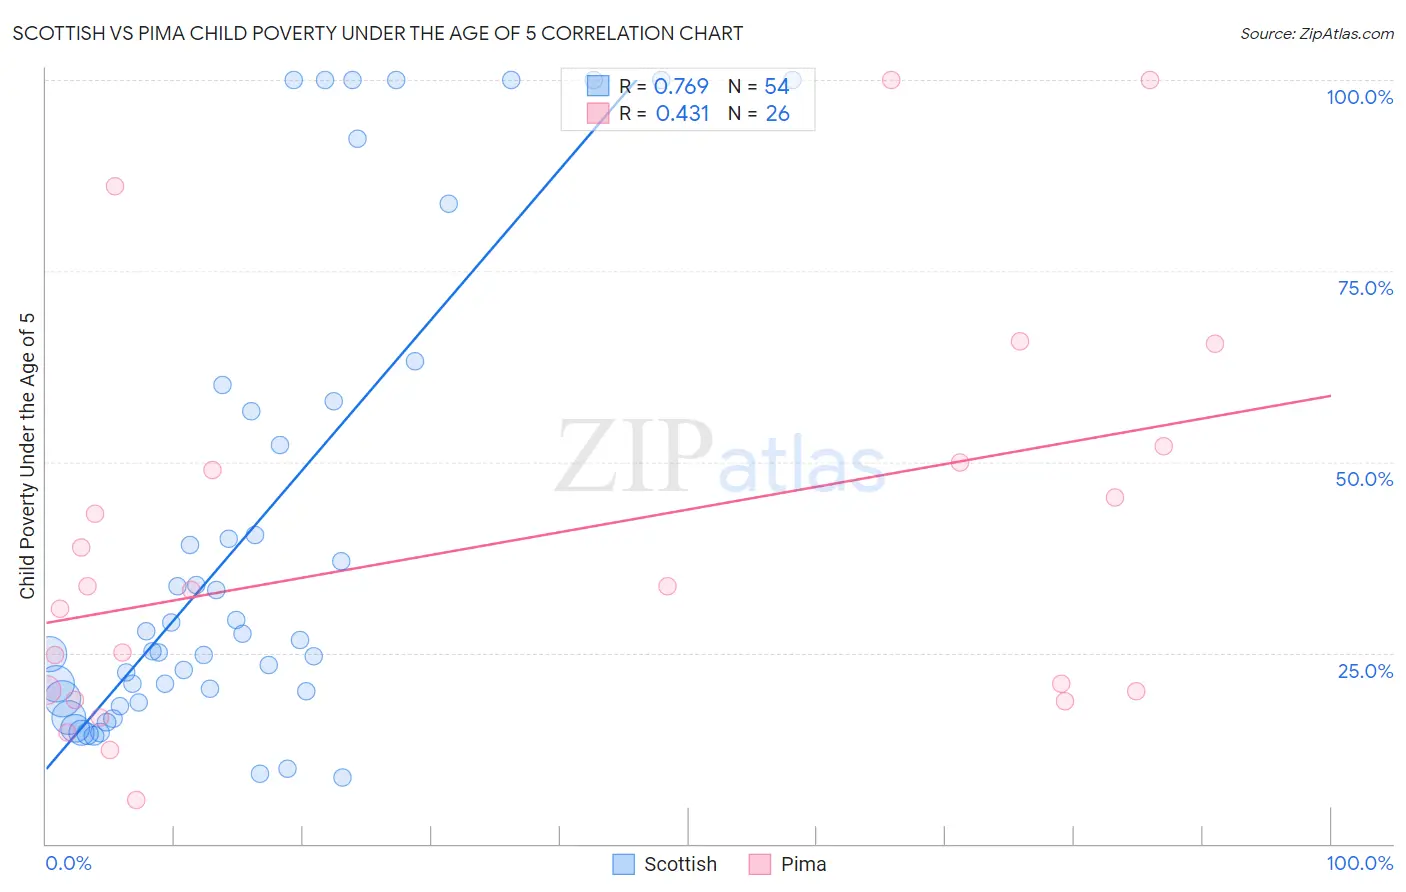
Scottish vs Pima Child Poverty Under the Age of 5 Correlation Chart
The statistical analysis conducted on geographies consisting of 526,633,659 people shows a strong positive correlation between the proportion of Scottish and poverty level among children under the age of 5 in the United States with a correlation coefficient (R) of 0.769 and weighted average of 16.9%. Similarly, the statistical analysis conducted on geographies consisting of 61,270,853 people shows a moderate positive correlation between the proportion of Pima and poverty level among children under the age of 5 in the United States with a correlation coefficient (R) of 0.431 and weighted average of 27.4%, a difference of 62.5%.
Child Poverty Under the Age of 5 Correlation Summary
| Measurement | Scottish | Pima |
| Minimum | 8.7% | 5.8% |
| Maximum | 100.0% | 100.0% |
| Range | 91.3% | 94.2% |
| Mean | 40.1% | 39.4% |
| Median | 25.9% | 33.4% |
| Interquartile 25% (IQ1) | 18.9% | 20.0% |
| Interquartile 75% (IQ3) | 56.6% | 50.0% |
| Interquartile Range (IQR) | 37.6% | 30.0% |
| Standard Deviation (Sample) | 30.4% | 26.0% |
| Standard Deviation (Population) | 30.1% | 25.5% |
Similar Demographics by Child Poverty Under the Age of 5
Demographics Similar to Scottish by Child Poverty Under the Age of 5
In terms of child poverty under the age of 5, the demographic groups most similar to Scottish are Immigrants from Oceania (16.9%, a difference of 0.12%), Costa Rican (16.9%, a difference of 0.15%), English (16.8%, a difference of 0.21%), Immigrants from Colombia (16.9%, a difference of 0.21%), and Irish (16.8%, a difference of 0.43%).
| Demographics | Rating | Rank | Child Poverty Under the Age of 5 |
| Afghans | 74.4 /100 | #156 | Good 16.8% |
| Venezuelans | 73.7 /100 | #157 | Good 16.8% |
| Czechoslovakians | 72.5 /100 | #158 | Good 16.8% |
| Immigrants | Syria | 72.3 /100 | #159 | Good 16.8% |
| Irish | 72.0 /100 | #160 | Good 16.8% |
| English | 70.4 /100 | #161 | Good 16.8% |
| Costa Ricans | 69.8 /100 | #162 | Good 16.9% |
| Scottish | 68.6 /100 | #163 | Good 16.9% |
| Immigrants | Oceania | 67.6 /100 | #164 | Good 16.9% |
| Immigrants | Colombia | 66.9 /100 | #165 | Good 16.9% |
| Slavs | 64.0 /100 | #166 | Good 17.0% |
| Immigrants | Uzbekistan | 62.0 /100 | #167 | Good 17.0% |
| Uruguayans | 60.5 /100 | #168 | Good 17.0% |
| Immigrants | South America | 60.0 /100 | #169 | Good 17.1% |
| Immigrants | Western Asia | 59.2 /100 | #170 | Average 17.1% |
Demographics Similar to Pima by Child Poverty Under the Age of 5
In terms of child poverty under the age of 5, the demographic groups most similar to Pima are Hopi (27.7%, a difference of 1.0%), Yup'ik (27.7%, a difference of 1.1%), Sioux (26.9%, a difference of 1.9%), Cheyenne (28.3%, a difference of 3.3%), and Colville (25.7%, a difference of 6.8%).
| Demographics | Rating | Rank | Child Poverty Under the Age of 5 |
| Creek | 0.0 /100 | #330 | Tragic 24.2% |
| Kiowa | 0.0 /100 | #331 | Tragic 24.5% |
| Apache | 0.0 /100 | #332 | Tragic 25.0% |
| Natives/Alaskans | 0.0 /100 | #333 | Tragic 25.6% |
| Blacks/African Americans | 0.0 /100 | #334 | Tragic 25.7% |
| Colville | 0.0 /100 | #335 | Tragic 25.7% |
| Sioux | 0.0 /100 | #336 | Tragic 26.9% |
| Pima | 0.0 /100 | #337 | Tragic 27.4% |
| Hopi | 0.0 /100 | #338 | Tragic 27.7% |
| Yup'ik | 0.0 /100 | #339 | Tragic 27.7% |
| Cheyenne | 0.0 /100 | #340 | Tragic 28.3% |
| Immigrants | Yemen | 0.0 /100 | #341 | Tragic 29.3% |
| Tohono O'odham | 0.0 /100 | #342 | Tragic 29.5% |
| Yuman | 0.0 /100 | #343 | Tragic 29.5% |
| Crow | 0.0 /100 | #344 | Tragic 31.0% |