Scottish vs Finnish Female Poverty
COMPARE
Scottish
Finnish
Female Poverty
Female Poverty Comparison
Scottish
Finns
12.5%
FEMALE POVERTY
94.1/ 100
METRIC RATING
105th/ 347
METRIC RANK
12.4%
FEMALE POVERTY
96.4/ 100
METRIC RATING
88th/ 347
METRIC RANK
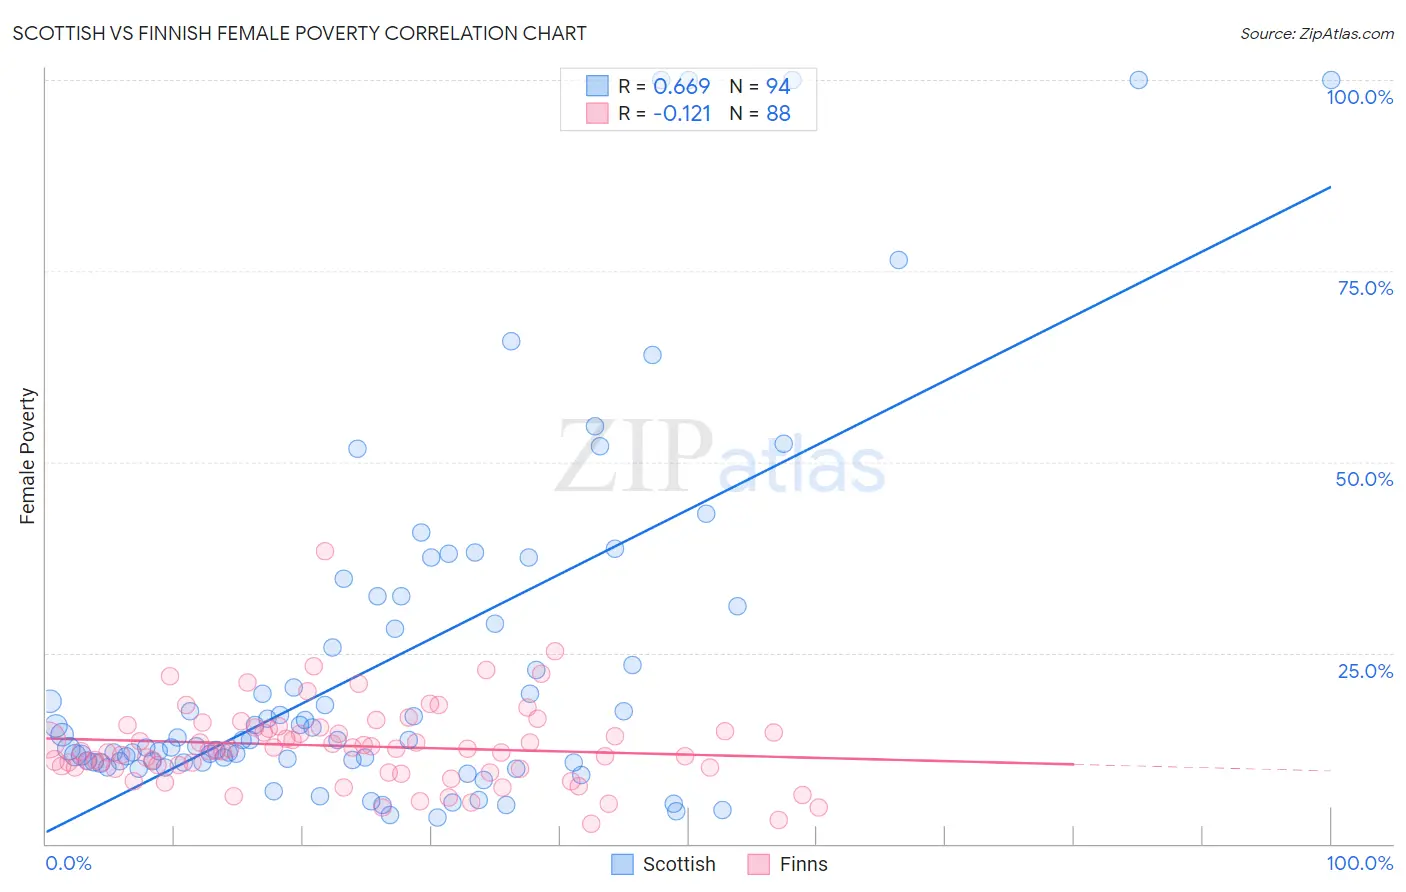
Scottish vs Finnish Female Poverty Correlation Chart
The statistical analysis conducted on geographies consisting of 565,877,668 people shows a significant positive correlation between the proportion of Scottish and poverty level among females in the United States with a correlation coefficient (R) of 0.669 and weighted average of 12.5%. Similarly, the statistical analysis conducted on geographies consisting of 404,419,462 people shows a poor negative correlation between the proportion of Finns and poverty level among females in the United States with a correlation coefficient (R) of -0.121 and weighted average of 12.4%, a difference of 1.3%.
Female Poverty Correlation Summary
| Measurement | Scottish | Finnish |
| Minimum | 3.5% | 2.6% |
| Maximum | 100.0% | 38.3% |
| Range | 96.5% | 35.7% |
| Mean | 23.6% | 12.8% |
| Median | 13.6% | 12.3% |
| Interquartile 25% (IQ1) | 10.7% | 9.9% |
| Interquartile 75% (IQ3) | 28.8% | 15.1% |
| Interquartile Range (IQR) | 18.1% | 5.2% |
| Standard Deviation (Sample) | 23.5% | 5.4% |
| Standard Deviation (Population) | 23.4% | 5.3% |
Demographics Similar to Scottish and Finns by Female Poverty
In terms of female poverty, the demographic groups most similar to Scottish are Palestinian (12.5%, a difference of 0.11%), Immigrants from Turkey (12.6%, a difference of 0.12%), Slavic (12.5%, a difference of 0.20%), Immigrants from China (12.5%, a difference of 0.22%), and Immigrants from Latvia (12.5%, a difference of 0.37%). Similarly, the demographic groups most similar to Finns are Okinawan (12.4%, a difference of 0.050%), Dutch (12.4%, a difference of 0.060%), English (12.4%, a difference of 0.20%), Immigrants from Denmark (12.4%, a difference of 0.42%), and Belgian (12.4%, a difference of 0.43%).
| Demographics | Rating | Rank | Female Poverty |
| Dutch | 96.5 /100 | #86 | Exceptional 12.4% |
| Okinawans | 96.4 /100 | #87 | Exceptional 12.4% |
| Finns | 96.4 /100 | #88 | Exceptional 12.4% |
| English | 96.1 /100 | #89 | Exceptional 12.4% |
| Immigrants | Denmark | 95.8 /100 | #90 | Exceptional 12.4% |
| Belgians | 95.8 /100 | #91 | Exceptional 12.4% |
| Czechoslovakians | 95.7 /100 | #92 | Exceptional 12.4% |
| Immigrants | Egypt | 95.5 /100 | #93 | Exceptional 12.5% |
| Immigrants | Indonesia | 95.4 /100 | #94 | Exceptional 12.5% |
| Immigrants | South Africa | 95.4 /100 | #95 | Exceptional 12.5% |
| British | 95.2 /100 | #96 | Exceptional 12.5% |
| Australians | 95.2 /100 | #97 | Exceptional 12.5% |
| Native Hawaiians | 95.1 /100 | #98 | Exceptional 12.5% |
| Romanians | 95.1 /100 | #99 | Exceptional 12.5% |
| Immigrants | Latvia | 94.8 /100 | #100 | Exceptional 12.5% |
| Tlingit-Haida | 94.8 /100 | #101 | Exceptional 12.5% |
| Immigrants | China | 94.5 /100 | #102 | Exceptional 12.5% |
| Slavs | 94.5 /100 | #103 | Exceptional 12.5% |
| Palestinians | 94.3 /100 | #104 | Exceptional 12.5% |
| Scottish | 94.1 /100 | #105 | Exceptional 12.5% |
| Immigrants | Turkey | 93.8 /100 | #106 | Exceptional 12.6% |