Immigrants from Iraq vs Pima Female Poverty
COMPARE
Immigrants from Iraq
Pima
Female Poverty
Female Poverty Comparison
Immigrants from Iraq
Pima
13.4%
FEMALE POVERTY
50.0/ 100
METRIC RATING
174th/ 347
METRIC RANK
23.6%
FEMALE POVERTY
0.0/ 100
METRIC RATING
344th/ 347
METRIC RANK
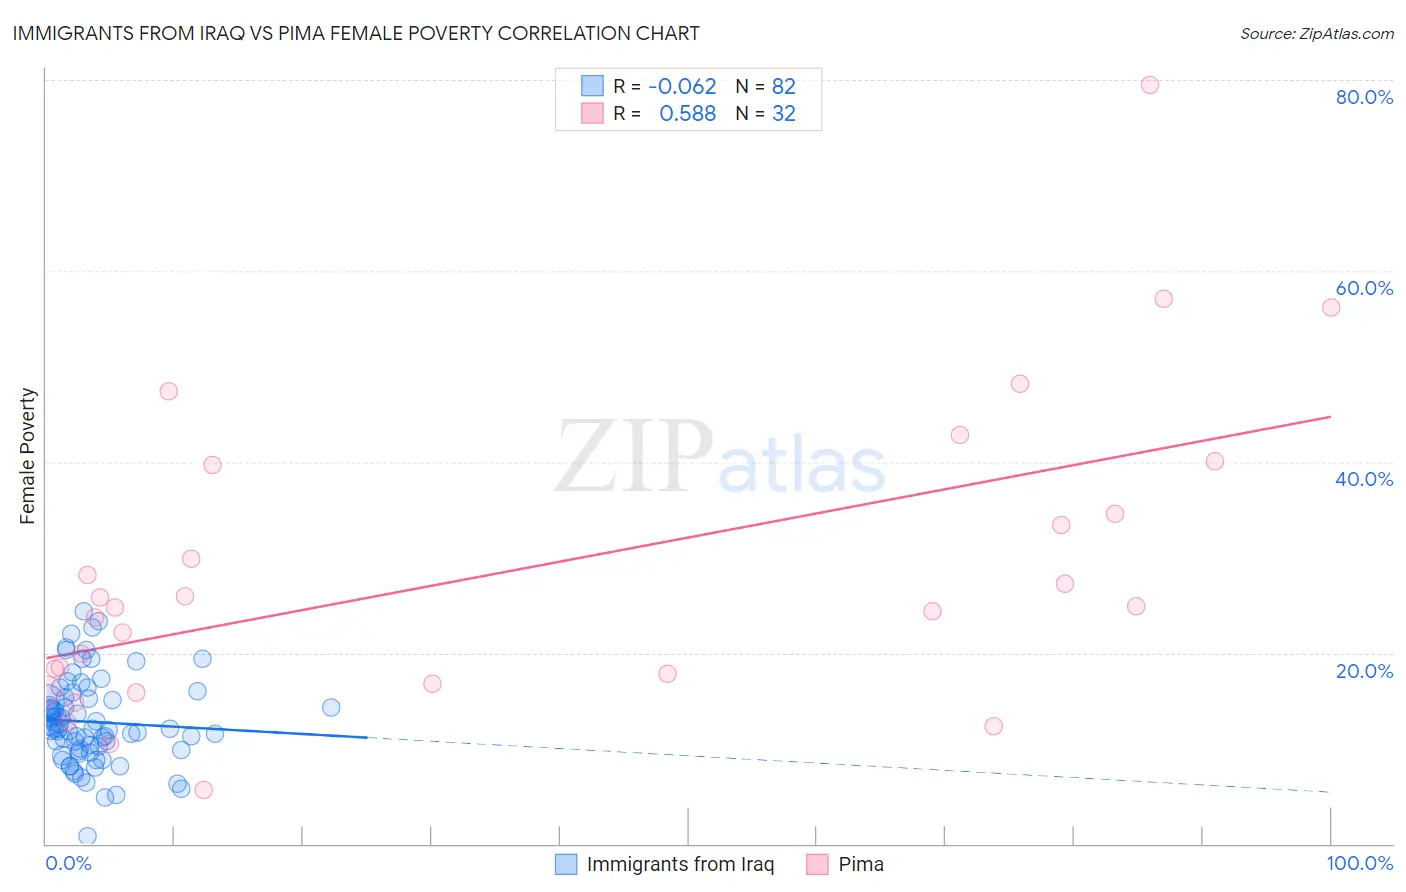
Immigrants from Iraq vs Pima Female Poverty Correlation Chart
The statistical analysis conducted on geographies consisting of 194,711,025 people shows a slight negative correlation between the proportion of Immigrants from Iraq and poverty level among females in the United States with a correlation coefficient (R) of -0.062 and weighted average of 13.4%. Similarly, the statistical analysis conducted on geographies consisting of 61,538,212 people shows a substantial positive correlation between the proportion of Pima and poverty level among females in the United States with a correlation coefficient (R) of 0.588 and weighted average of 23.6%, a difference of 75.4%.
Female Poverty Correlation Summary
| Measurement | Immigrants from Iraq | Pima |
| Minimum | 0.80% | 5.7% |
| Maximum | 24.3% | 79.5% |
| Range | 23.5% | 73.8% |
| Mean | 12.7% | 28.6% |
| Median | 12.1% | 24.8% |
| Interquartile 25% (IQ1) | 9.8% | 17.3% |
| Interquartile 75% (IQ3) | 15.1% | 37.2% |
| Interquartile Range (IQR) | 5.3% | 19.9% |
| Standard Deviation (Sample) | 4.5% | 16.0% |
| Standard Deviation (Population) | 4.5% | 15.8% |
Similar Demographics by Female Poverty
Demographics Similar to Immigrants from Iraq by Female Poverty
In terms of female poverty, the demographic groups most similar to Immigrants from Iraq are Celtic (13.4%, a difference of 0.010%), Immigrants from Spain (13.4%, a difference of 0.010%), Immigrants from Morocco (13.4%, a difference of 0.060%), Immigrants from Afghanistan (13.4%, a difference of 0.070%), and Israeli (13.5%, a difference of 0.090%).
| Demographics | Rating | Rank | Female Poverty |
| Immigrants | Chile | 57.4 /100 | #167 | Average 13.3% |
| Aleuts | 56.7 /100 | #168 | Average 13.4% |
| Lebanese | 55.9 /100 | #169 | Average 13.4% |
| Colombians | 55.7 /100 | #170 | Average 13.4% |
| Whites/Caucasians | 54.6 /100 | #171 | Average 13.4% |
| Mongolians | 53.6 /100 | #172 | Average 13.4% |
| Immigrants | Afghanistan | 50.8 /100 | #173 | Average 13.4% |
| Immigrants | Iraq | 50.0 /100 | #174 | Average 13.4% |
| Celtics | 49.9 /100 | #175 | Average 13.4% |
| Immigrants | Spain | 49.9 /100 | #176 | Average 13.4% |
| Immigrants | Morocco | 49.4 /100 | #177 | Average 13.4% |
| Israelis | 49.1 /100 | #178 | Average 13.5% |
| Immigrants | Syria | 48.8 /100 | #179 | Average 13.5% |
| South Americans | 44.8 /100 | #180 | Average 13.5% |
| Venezuelans | 44.5 /100 | #181 | Average 13.5% |
Demographics Similar to Pima by Female Poverty
In terms of female poverty, the demographic groups most similar to Pima are Lumbee (23.5%, a difference of 0.31%), Navajo (23.9%, a difference of 1.3%), Immigrants from Yemen (22.8%, a difference of 3.3%), Crow (22.1%, a difference of 6.5%), and Puerto Rican (25.2%, a difference of 6.8%).
| Demographics | Rating | Rank | Female Poverty |
| Immigrants | Dominican Republic | 0.0 /100 | #333 | Tragic 19.3% |
| Houma | 0.0 /100 | #334 | Tragic 20.0% |
| Cheyenne | 0.0 /100 | #335 | Tragic 20.2% |
| Pueblo | 0.0 /100 | #336 | Tragic 20.7% |
| Yuman | 0.0 /100 | #337 | Tragic 20.8% |
| Sioux | 0.0 /100 | #338 | Tragic 20.9% |
| Hopi | 0.0 /100 | #339 | Tragic 21.0% |
| Yup'ik | 0.0 /100 | #340 | Tragic 21.5% |
| Crow | 0.0 /100 | #341 | Tragic 22.1% |
| Immigrants | Yemen | 0.0 /100 | #342 | Tragic 22.8% |
| Lumbee | 0.0 /100 | #343 | Tragic 23.5% |
| Pima | 0.0 /100 | #344 | Tragic 23.6% |
| Navajo | 0.0 /100 | #345 | Tragic 23.9% |
| Puerto Ricans | 0.0 /100 | #346 | Tragic 25.2% |
| Tohono O'odham | 0.0 /100 | #347 | Tragic 25.9% |