Marshallese vs Immigrants from China Child Poverty Among Girls Under 16
COMPARE
Marshallese
Immigrants from China
Child Poverty Among Girls Under 16
Child Poverty Among Girls Under 16 Comparison
Marshallese
Immigrants from China
18.7%
CHILD POVERTY AMONG GIRLS UNDER 16
0.9/ 100
METRIC RATING
239th/ 347
METRIC RANK
13.4%
CHILD POVERTY AMONG GIRLS UNDER 16
99.8/ 100
METRIC RATING
25th/ 347
METRIC RANK
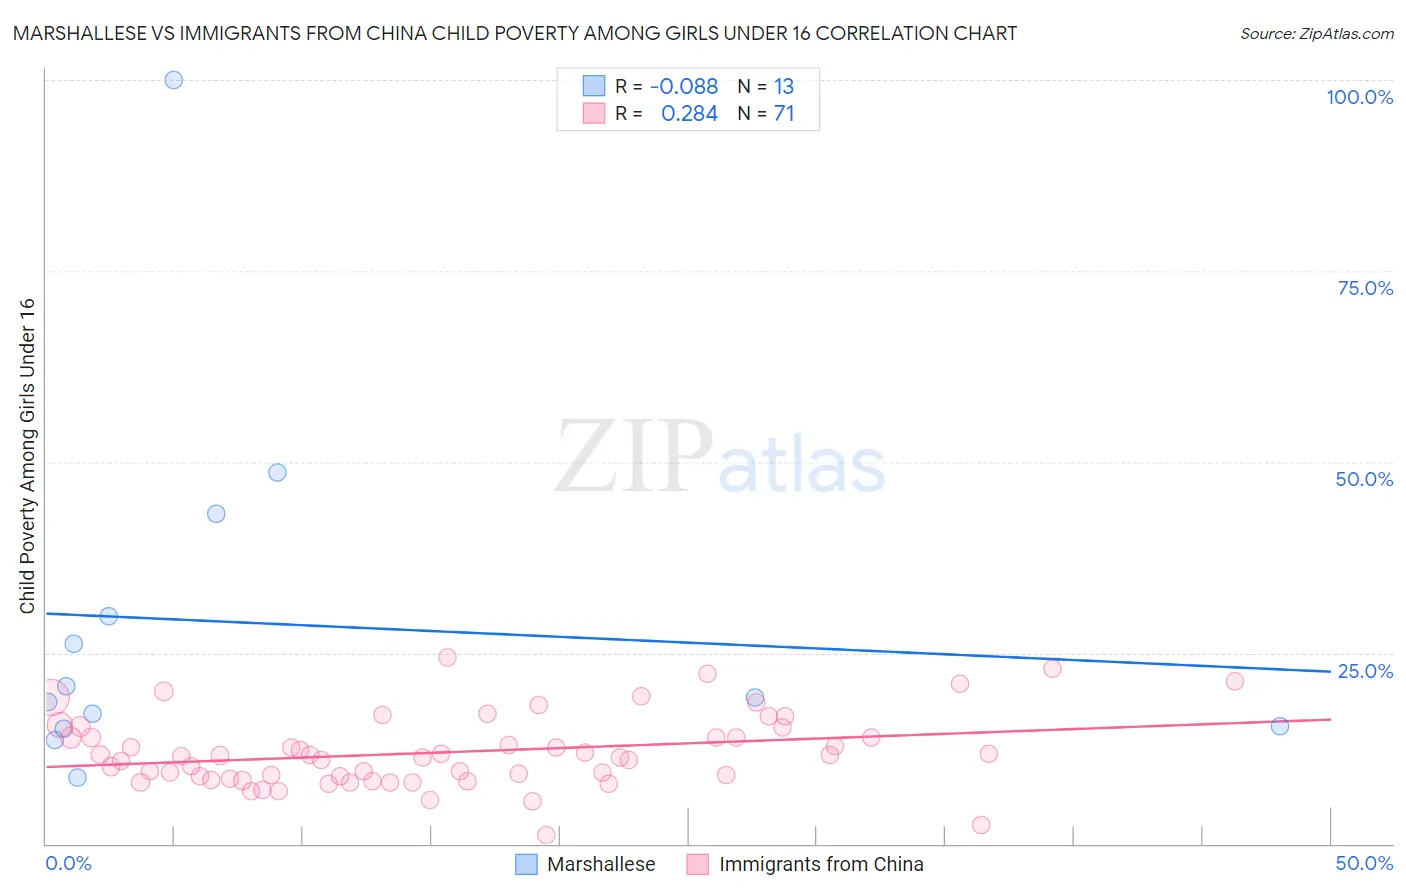
Marshallese vs Immigrants from China Child Poverty Among Girls Under 16 Correlation Chart
The statistical analysis conducted on geographies consisting of 14,733,335 people shows a slight negative correlation between the proportion of Marshallese and poverty level among girls under the age of 16 in the United States with a correlation coefficient (R) of -0.088 and weighted average of 18.7%. Similarly, the statistical analysis conducted on geographies consisting of 445,396,670 people shows a weak positive correlation between the proportion of Immigrants from China and poverty level among girls under the age of 16 in the United States with a correlation coefficient (R) of 0.284 and weighted average of 13.4%, a difference of 39.1%.
Child Poverty Among Girls Under 16 Correlation Summary
| Measurement | Marshallese | Immigrants from China |
| Minimum | 8.7% | 1.1% |
| Maximum | 100.0% | 24.4% |
| Range | 91.3% | 23.3% |
| Mean | 28.9% | 12.0% |
| Median | 19.2% | 11.4% |
| Interquartile 25% (IQ1) | 15.2% | 8.6% |
| Interquartile 75% (IQ3) | 36.5% | 14.0% |
| Interquartile Range (IQR) | 21.3% | 5.4% |
| Standard Deviation (Sample) | 24.3% | 4.7% |
| Standard Deviation (Population) | 23.3% | 4.7% |
Similar Demographics by Child Poverty Among Girls Under 16
Demographics Similar to Marshallese by Child Poverty Among Girls Under 16
In terms of child poverty among girls under 16, the demographic groups most similar to Marshallese are Immigrants from Eritrea (18.7%, a difference of 0.070%), Nigerian (18.7%, a difference of 0.14%), Immigrants from Nigeria (18.6%, a difference of 0.21%), Alsatian (18.6%, a difference of 0.33%), and Nepalese (18.6%, a difference of 0.35%).
| Demographics | Rating | Rank | Child Poverty Among Girls Under 16 |
| Immigrants | Sudan | 1.1 /100 | #232 | Tragic 18.6% |
| Sudanese | 1.1 /100 | #233 | Tragic 18.6% |
| Fijians | 1.1 /100 | #234 | Tragic 18.6% |
| Nepalese | 1.1 /100 | #235 | Tragic 18.6% |
| Alsatians | 1.1 /100 | #236 | Tragic 18.6% |
| Immigrants | Nigeria | 1.0 /100 | #237 | Tragic 18.6% |
| Immigrants | Eritrea | 1.0 /100 | #238 | Tragic 18.7% |
| Marshallese | 0.9 /100 | #239 | Tragic 18.7% |
| Nigerians | 0.9 /100 | #240 | Tragic 18.7% |
| Americans | 0.8 /100 | #241 | Tragic 18.8% |
| Immigrants | Cuba | 0.7 /100 | #242 | Tragic 18.8% |
| Immigrants | Nicaragua | 0.7 /100 | #243 | Tragic 18.8% |
| Ecuadorians | 0.7 /100 | #244 | Tragic 18.8% |
| Shoshone | 0.6 /100 | #245 | Tragic 18.9% |
| Immigrants | Laos | 0.6 /100 | #246 | Tragic 18.9% |
Demographics Similar to Immigrants from China by Child Poverty Among Girls Under 16
In terms of child poverty among girls under 16, the demographic groups most similar to Immigrants from China are Immigrants from Eastern Asia (13.4%, a difference of 0.46%), Norwegian (13.3%, a difference of 0.55%), Indian (Asian) (13.3%, a difference of 0.72%), Eastern European (13.5%, a difference of 0.78%), and Latvian (13.5%, a difference of 0.81%).
| Demographics | Rating | Rank | Child Poverty Among Girls Under 16 |
| Immigrants | Korea | 99.9 /100 | #18 | Exceptional 13.1% |
| Cypriots | 99.9 /100 | #19 | Exceptional 13.2% |
| Immigrants | Japan | 99.9 /100 | #20 | Exceptional 13.3% |
| Assyrians/Chaldeans/Syriacs | 99.9 /100 | #21 | Exceptional 13.3% |
| Indians (Asian) | 99.9 /100 | #22 | Exceptional 13.3% |
| Norwegians | 99.9 /100 | #23 | Exceptional 13.3% |
| Immigrants | Eastern Asia | 99.9 /100 | #24 | Exceptional 13.4% |
| Immigrants | China | 99.8 /100 | #25 | Exceptional 13.4% |
| Eastern Europeans | 99.8 /100 | #26 | Exceptional 13.5% |
| Latvians | 99.8 /100 | #27 | Exceptional 13.5% |
| Tongans | 99.8 /100 | #28 | Exceptional 13.6% |
| Bolivians | 99.8 /100 | #29 | Exceptional 13.6% |
| Asians | 99.7 /100 | #30 | Exceptional 13.7% |
| Turks | 99.7 /100 | #31 | Exceptional 13.7% |
| Danes | 99.7 /100 | #32 | Exceptional 13.7% |