Ukrainian vs Immigrants from China Child Poverty Among Girls Under 16
COMPARE
Ukrainian
Immigrants from China
Child Poverty Among Girls Under 16
Child Poverty Among Girls Under 16 Comparison
Ukrainians
Immigrants from China
14.7%
CHILD POVERTY AMONG GIRLS UNDER 16
97.7/ 100
METRIC RATING
81st/ 347
METRIC RANK
13.4%
CHILD POVERTY AMONG GIRLS UNDER 16
99.8/ 100
METRIC RATING
25th/ 347
METRIC RANK
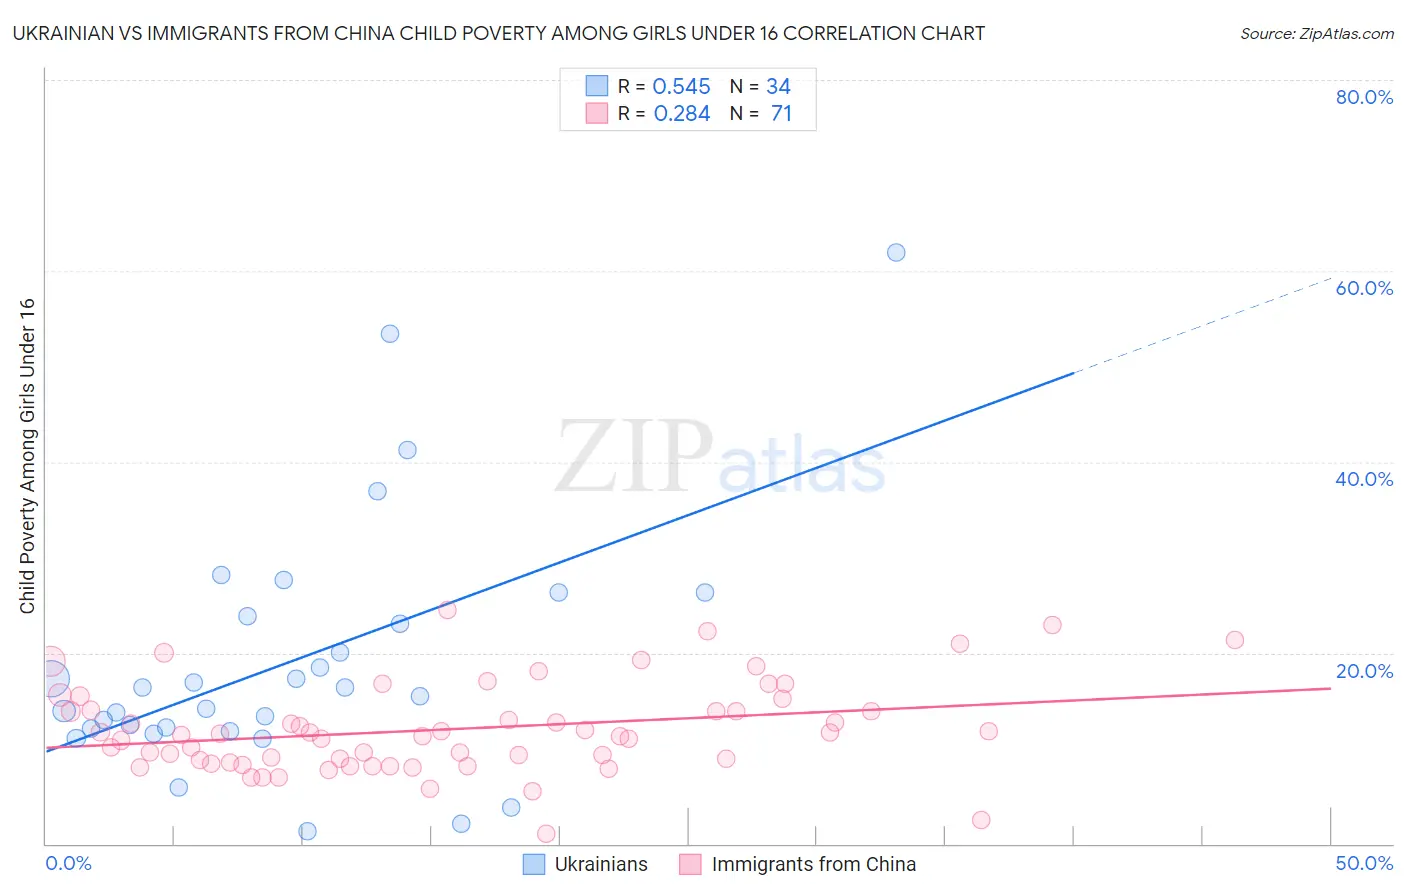
Ukrainian vs Immigrants from China Child Poverty Among Girls Under 16 Correlation Chart
The statistical analysis conducted on geographies consisting of 435,732,130 people shows a substantial positive correlation between the proportion of Ukrainians and poverty level among girls under the age of 16 in the United States with a correlation coefficient (R) of 0.545 and weighted average of 14.7%. Similarly, the statistical analysis conducted on geographies consisting of 445,396,670 people shows a weak positive correlation between the proportion of Immigrants from China and poverty level among girls under the age of 16 in the United States with a correlation coefficient (R) of 0.284 and weighted average of 13.4%, a difference of 9.4%.
Child Poverty Among Girls Under 16 Correlation Summary
| Measurement | Ukrainian | Immigrants from China |
| Minimum | 1.3% | 1.1% |
| Maximum | 61.9% | 24.4% |
| Range | 60.6% | 23.3% |
| Mean | 19.1% | 12.0% |
| Median | 15.9% | 11.4% |
| Interquartile 25% (IQ1) | 12.1% | 8.6% |
| Interquartile 75% (IQ3) | 23.9% | 14.0% |
| Interquartile Range (IQR) | 11.8% | 5.4% |
| Standard Deviation (Sample) | 13.2% | 4.7% |
| Standard Deviation (Population) | 13.0% | 4.7% |
Similar Demographics by Child Poverty Among Girls Under 16
Demographics Similar to Ukrainians by Child Poverty Among Girls Under 16
In terms of child poverty among girls under 16, the demographic groups most similar to Ukrainians are Immigrants from Turkey (14.7%, a difference of 0.19%), Egyptian (14.7%, a difference of 0.19%), Argentinean (14.7%, a difference of 0.21%), Tlingit-Haida (14.7%, a difference of 0.22%), and Immigrants from Russia (14.7%, a difference of 0.23%).
| Demographics | Rating | Rank | Child Poverty Among Girls Under 16 |
| Taiwanese | 98.0 /100 | #74 | Exceptional 14.6% |
| Immigrants | Eastern Europe | 98.0 /100 | #75 | Exceptional 14.6% |
| Immigrants | Russia | 97.9 /100 | #76 | Exceptional 14.7% |
| Tlingit-Haida | 97.9 /100 | #77 | Exceptional 14.7% |
| Argentineans | 97.9 /100 | #78 | Exceptional 14.7% |
| Immigrants | Turkey | 97.9 /100 | #79 | Exceptional 14.7% |
| Egyptians | 97.9 /100 | #80 | Exceptional 14.7% |
| Ukrainians | 97.7 /100 | #81 | Exceptional 14.7% |
| Macedonians | 97.6 /100 | #82 | Exceptional 14.7% |
| Immigrants | Italy | 97.4 /100 | #83 | Exceptional 14.8% |
| Soviet Union | 97.3 /100 | #84 | Exceptional 14.8% |
| Swiss | 97.2 /100 | #85 | Exceptional 14.8% |
| Australians | 97.2 /100 | #86 | Exceptional 14.8% |
| Finns | 97.2 /100 | #87 | Exceptional 14.8% |
| Immigrants | Canada | 97.1 /100 | #88 | Exceptional 14.8% |
Demographics Similar to Immigrants from China by Child Poverty Among Girls Under 16
In terms of child poverty among girls under 16, the demographic groups most similar to Immigrants from China are Immigrants from Eastern Asia (13.4%, a difference of 0.46%), Norwegian (13.3%, a difference of 0.55%), Indian (Asian) (13.3%, a difference of 0.72%), Eastern European (13.5%, a difference of 0.78%), and Latvian (13.5%, a difference of 0.81%).
| Demographics | Rating | Rank | Child Poverty Among Girls Under 16 |
| Immigrants | Korea | 99.9 /100 | #18 | Exceptional 13.1% |
| Cypriots | 99.9 /100 | #19 | Exceptional 13.2% |
| Immigrants | Japan | 99.9 /100 | #20 | Exceptional 13.3% |
| Assyrians/Chaldeans/Syriacs | 99.9 /100 | #21 | Exceptional 13.3% |
| Indians (Asian) | 99.9 /100 | #22 | Exceptional 13.3% |
| Norwegians | 99.9 /100 | #23 | Exceptional 13.3% |
| Immigrants | Eastern Asia | 99.9 /100 | #24 | Exceptional 13.4% |
| Immigrants | China | 99.8 /100 | #25 | Exceptional 13.4% |
| Eastern Europeans | 99.8 /100 | #26 | Exceptional 13.5% |
| Latvians | 99.8 /100 | #27 | Exceptional 13.5% |
| Tongans | 99.8 /100 | #28 | Exceptional 13.6% |
| Bolivians | 99.8 /100 | #29 | Exceptional 13.6% |
| Asians | 99.7 /100 | #30 | Exceptional 13.7% |
| Turks | 99.7 /100 | #31 | Exceptional 13.7% |
| Danes | 99.7 /100 | #32 | Exceptional 13.7% |