Marshallese vs Immigrants from China Family Poverty
COMPARE
Marshallese
Immigrants from China
Family Poverty
Family Poverty Comparison
Marshallese
Immigrants from China
9.9%
FAMILY POVERTY
3.9/ 100
METRIC RATING
224th/ 347
METRIC RANK
7.8%
FAMILY POVERTY
98.1/ 100
METRIC RATING
74th/ 347
METRIC RANK
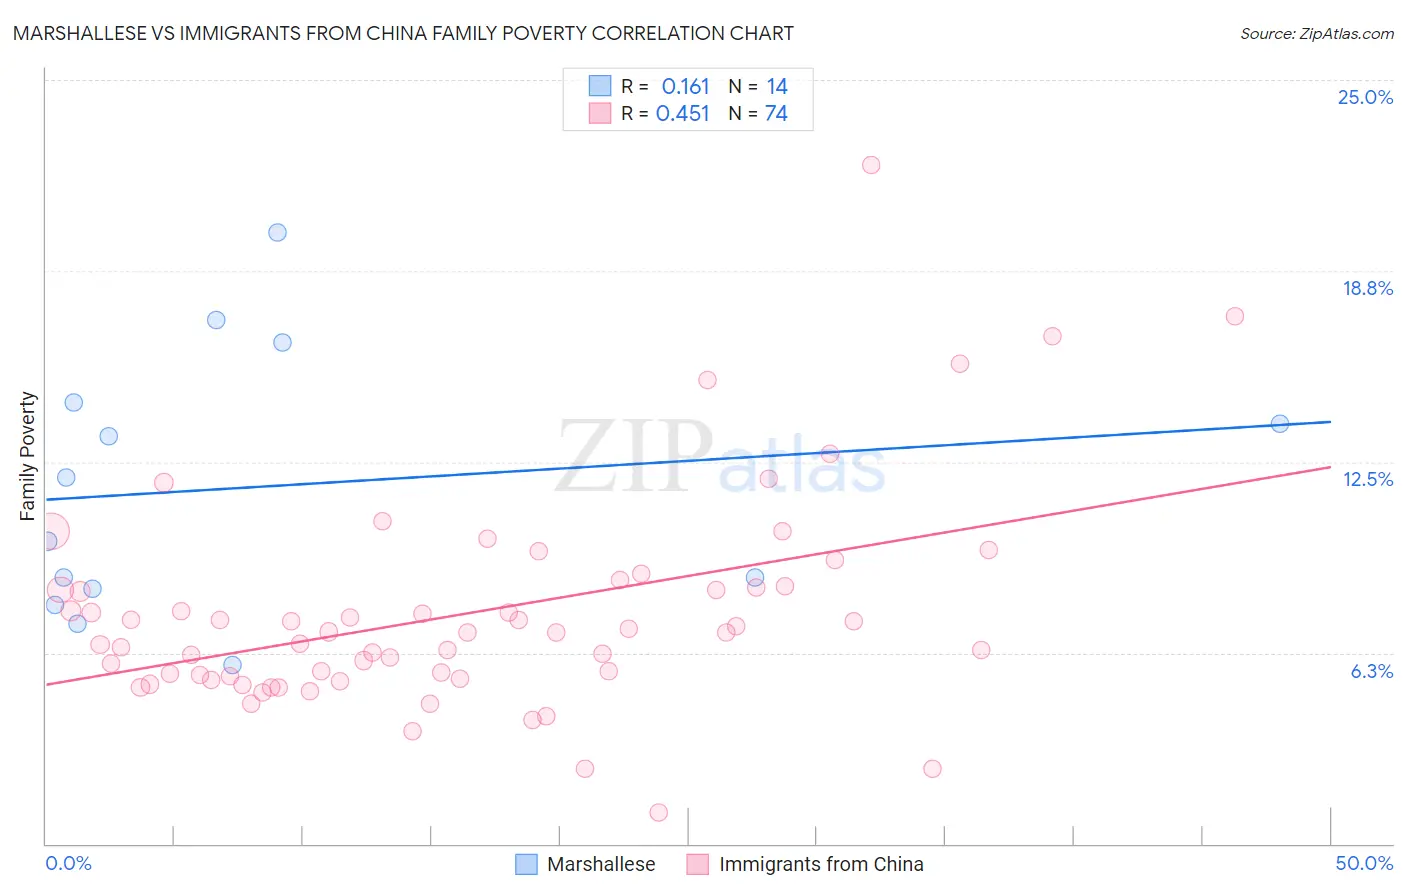
Marshallese vs Immigrants from China Family Poverty Correlation Chart
The statistical analysis conducted on geographies consisting of 14,754,460 people shows a poor positive correlation between the proportion of Marshallese and poverty level among families in the United States with a correlation coefficient (R) of 0.161 and weighted average of 9.9%. Similarly, the statistical analysis conducted on geographies consisting of 454,907,220 people shows a moderate positive correlation between the proportion of Immigrants from China and poverty level among families in the United States with a correlation coefficient (R) of 0.451 and weighted average of 7.8%, a difference of 26.9%.
Family Poverty Correlation Summary
| Measurement | Marshallese | Immigrants from China |
| Minimum | 5.8% | 1.0% |
| Maximum | 20.0% | 22.2% |
| Range | 14.2% | 21.2% |
| Mean | 11.7% | 7.5% |
| Median | 10.9% | 6.9% |
| Interquartile 25% (IQ1) | 8.3% | 5.5% |
| Interquartile 75% (IQ3) | 14.5% | 8.4% |
| Interquartile Range (IQR) | 6.1% | 2.9% |
| Standard Deviation (Sample) | 4.3% | 3.5% |
| Standard Deviation (Population) | 4.1% | 3.4% |
Similar Demographics by Family Poverty
Demographics Similar to Marshallese by Family Poverty
In terms of family poverty, the demographic groups most similar to Marshallese are Immigrants (10.0%, a difference of 0.25%), Immigrants from Africa (9.9%, a difference of 0.30%), Ottawa (10.0%, a difference of 0.52%), Immigrants from Armenia (10.0%, a difference of 0.54%), and Japanese (9.9%, a difference of 0.60%).
| Demographics | Rating | Rank | Family Poverty |
| Americans | 6.2 /100 | #217 | Tragic 9.8% |
| Panamanians | 5.6 /100 | #218 | Tragic 9.8% |
| Immigrants | Eritrea | 5.4 /100 | #219 | Tragic 9.9% |
| Bermudans | 5.3 /100 | #220 | Tragic 9.9% |
| Immigrants | Cambodia | 4.8 /100 | #221 | Tragic 9.9% |
| Japanese | 4.8 /100 | #222 | Tragic 9.9% |
| Immigrants | Africa | 4.3 /100 | #223 | Tragic 9.9% |
| Marshallese | 3.9 /100 | #224 | Tragic 9.9% |
| Immigrants | Immigrants | 3.6 /100 | #225 | Tragic 10.0% |
| Ottawa | 3.3 /100 | #226 | Tragic 10.0% |
| Immigrants | Armenia | 3.3 /100 | #227 | Tragic 10.0% |
| Sudanese | 3.1 /100 | #228 | Tragic 10.0% |
| Immigrants | Uzbekistan | 3.1 /100 | #229 | Tragic 10.0% |
| Immigrants | Panama | 3.1 /100 | #230 | Tragic 10.0% |
| Alaskan Athabascans | 2.7 /100 | #231 | Tragic 10.1% |
Demographics Similar to Immigrants from China by Family Poverty
In terms of family poverty, the demographic groups most similar to Immigrants from China are Austrian (7.8%, a difference of 0.070%), Immigrants from Romania (7.8%, a difference of 0.080%), Cambodian (7.8%, a difference of 0.14%), Immigrants from Croatia (7.8%, a difference of 0.14%), and Immigrants from Canada (7.8%, a difference of 0.16%).
| Demographics | Rating | Rank | Family Poverty |
| Northern Europeans | 98.3 /100 | #67 | Exceptional 7.8% |
| Australians | 98.2 /100 | #68 | Exceptional 7.8% |
| Immigrants | Belgium | 98.2 /100 | #69 | Exceptional 7.8% |
| Immigrants | Canada | 98.2 /100 | #70 | Exceptional 7.8% |
| Cambodians | 98.2 /100 | #71 | Exceptional 7.8% |
| Immigrants | Romania | 98.2 /100 | #72 | Exceptional 7.8% |
| Austrians | 98.2 /100 | #73 | Exceptional 7.8% |
| Immigrants | China | 98.1 /100 | #74 | Exceptional 7.8% |
| Immigrants | Croatia | 98.1 /100 | #75 | Exceptional 7.8% |
| Immigrants | Latvia | 98.0 /100 | #76 | Exceptional 7.9% |
| Ukrainians | 98.0 /100 | #77 | Exceptional 7.9% |
| Immigrants | North America | 97.9 /100 | #78 | Exceptional 7.9% |
| Immigrants | Europe | 97.8 /100 | #79 | Exceptional 7.9% |
| English | 97.8 /100 | #80 | Exceptional 7.9% |
| Irish | 97.8 /100 | #81 | Exceptional 7.9% |