Marshallese vs Immigrants from Micronesia Child Poverty Among Girls Under 16
COMPARE
Marshallese
Immigrants from Micronesia
Child Poverty Among Girls Under 16
Child Poverty Among Girls Under 16 Comparison
Marshallese
Immigrants from Micronesia
18.7%
CHILD POVERTY AMONG GIRLS UNDER 16
0.9/ 100
METRIC RATING
239th/ 347
METRIC RANK
18.0%
CHILD POVERTY AMONG GIRLS UNDER 16
3.5/ 100
METRIC RATING
221st/ 347
METRIC RANK
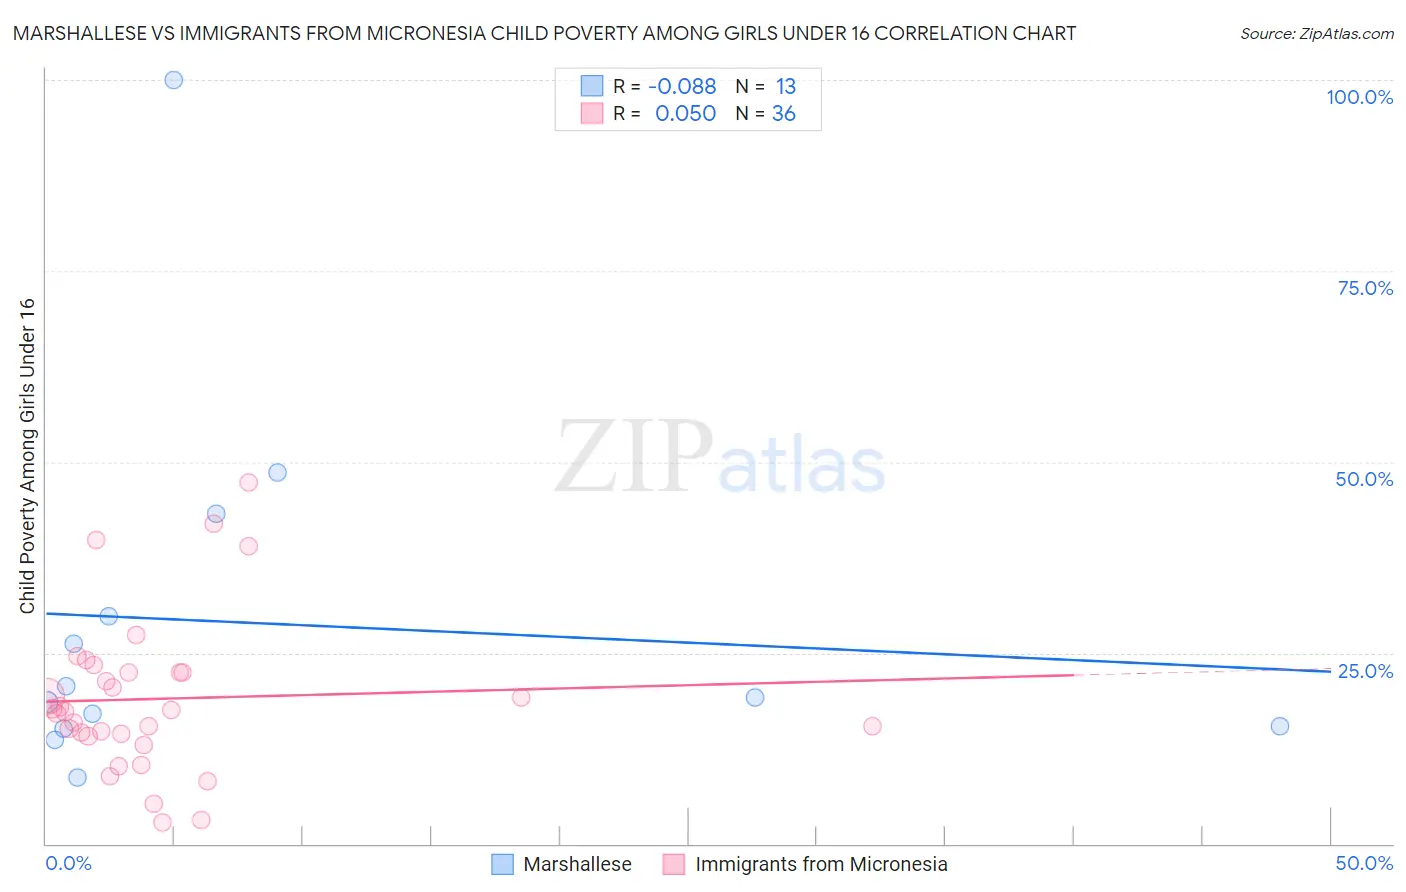
Marshallese vs Immigrants from Micronesia Child Poverty Among Girls Under 16 Correlation Chart
The statistical analysis conducted on geographies consisting of 14,733,335 people shows a slight negative correlation between the proportion of Marshallese and poverty level among girls under the age of 16 in the United States with a correlation coefficient (R) of -0.088 and weighted average of 18.7%. Similarly, the statistical analysis conducted on geographies consisting of 61,520,772 people shows no correlation between the proportion of Immigrants from Micronesia and poverty level among girls under the age of 16 in the United States with a correlation coefficient (R) of 0.050 and weighted average of 18.0%, a difference of 3.5%.
Child Poverty Among Girls Under 16 Correlation Summary
| Measurement | Marshallese | Immigrants from Micronesia |
| Minimum | 8.7% | 2.8% |
| Maximum | 100.0% | 47.3% |
| Range | 91.3% | 44.6% |
| Mean | 28.9% | 19.0% |
| Median | 19.2% | 17.4% |
| Interquartile 25% (IQ1) | 15.2% | 14.3% |
| Interquartile 75% (IQ3) | 36.5% | 22.4% |
| Interquartile Range (IQR) | 21.3% | 8.2% |
| Standard Deviation (Sample) | 24.3% | 10.2% |
| Standard Deviation (Population) | 23.3% | 10.0% |
Demographics Similar to Marshallese and Immigrants from Micronesia by Child Poverty Among Girls Under 16
In terms of child poverty among girls under 16, the demographic groups most similar to Marshallese are Immigrants from Eritrea (18.7%, a difference of 0.070%), Nigerian (18.7%, a difference of 0.14%), Immigrants from Nigeria (18.6%, a difference of 0.21%), Alsatian (18.6%, a difference of 0.33%), and Nepalese (18.6%, a difference of 0.35%). Similarly, the demographic groups most similar to Immigrants from Micronesia are Cuban (18.0%, a difference of 0.43%), Immigrants from Cambodia (18.1%, a difference of 0.52%), Immigrants from Armenia (18.1%, a difference of 0.52%), Bermudan (18.1%, a difference of 0.60%), and Immigrants from Africa (18.2%, a difference of 0.69%).
| Demographics | Rating | Rank | Child Poverty Among Girls Under 16 |
| Cubans | 4.1 /100 | #220 | Tragic 18.0% |
| Immigrants | Micronesia | 3.5 /100 | #221 | Tragic 18.0% |
| Immigrants | Cambodia | 2.9 /100 | #222 | Tragic 18.1% |
| Immigrants | Armenia | 2.9 /100 | #223 | Tragic 18.1% |
| Bermudans | 2.8 /100 | #224 | Tragic 18.1% |
| Immigrants | Africa | 2.7 /100 | #225 | Tragic 18.2% |
| Nicaraguans | 2.4 /100 | #226 | Tragic 18.2% |
| Immigrants | Nonimmigrants | 2.0 /100 | #227 | Tragic 18.3% |
| Alaskan Athabascans | 2.0 /100 | #228 | Tragic 18.3% |
| Ghanaians | 1.4 /100 | #229 | Tragic 18.5% |
| Osage | 1.3 /100 | #230 | Tragic 18.5% |
| Cree | 1.3 /100 | #231 | Tragic 18.5% |
| Immigrants | Sudan | 1.1 /100 | #232 | Tragic 18.6% |
| Sudanese | 1.1 /100 | #233 | Tragic 18.6% |
| Fijians | 1.1 /100 | #234 | Tragic 18.6% |
| Nepalese | 1.1 /100 | #235 | Tragic 18.6% |
| Alsatians | 1.1 /100 | #236 | Tragic 18.6% |
| Immigrants | Nigeria | 1.0 /100 | #237 | Tragic 18.6% |
| Immigrants | Eritrea | 1.0 /100 | #238 | Tragic 18.7% |
| Marshallese | 0.9 /100 | #239 | Tragic 18.7% |
| Nigerians | 0.9 /100 | #240 | Tragic 18.7% |