Immigrants from Oceania vs Egyptian Female Poverty
COMPARE
Immigrants from Oceania
Egyptian
Female Poverty
Female Poverty Comparison
Immigrants from Oceania
Egyptians
13.3%
FEMALE POVERTY
59.7/ 100
METRIC RATING
166th/ 347
METRIC RANK
12.3%
FEMALE POVERTY
97.2/ 100
METRIC RATING
78th/ 347
METRIC RANK
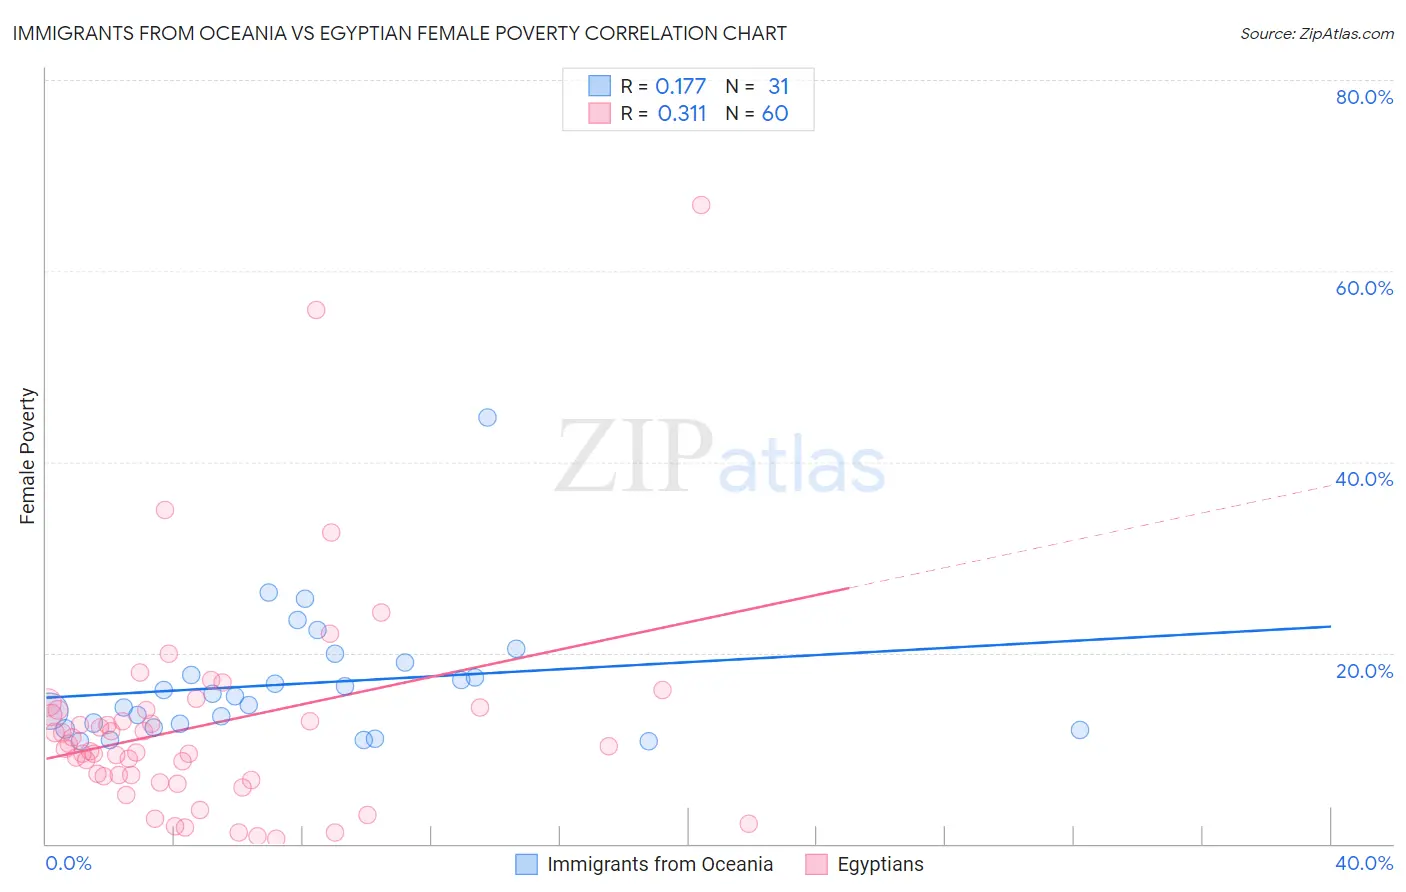
Immigrants from Oceania vs Egyptian Female Poverty Correlation Chart
The statistical analysis conducted on geographies consisting of 305,339,012 people shows a poor positive correlation between the proportion of Immigrants from Oceania and poverty level among females in the United States with a correlation coefficient (R) of 0.177 and weighted average of 13.3%. Similarly, the statistical analysis conducted on geographies consisting of 276,729,469 people shows a mild positive correlation between the proportion of Egyptians and poverty level among females in the United States with a correlation coefficient (R) of 0.311 and weighted average of 12.3%, a difference of 8.3%.
Female Poverty Correlation Summary
| Measurement | Immigrants from Oceania | Egyptian |
| Minimum | 10.7% | 0.56% |
| Maximum | 44.6% | 66.9% |
| Range | 33.9% | 66.4% |
| Mean | 16.8% | 12.4% |
| Median | 15.5% | 10.1% |
| Interquartile 25% (IQ1) | 12.2% | 6.9% |
| Interquartile 75% (IQ3) | 19.0% | 14.0% |
| Interquartile Range (IQR) | 6.8% | 7.1% |
| Standard Deviation (Sample) | 6.8% | 11.5% |
| Standard Deviation (Population) | 6.7% | 11.4% |
Similar Demographics by Female Poverty
Demographics Similar to Immigrants from Oceania by Female Poverty
In terms of female poverty, the demographic groups most similar to Immigrants from Oceania are Scotch-Irish (13.3%, a difference of 0.24%), Immigrants from Chile (13.3%, a difference of 0.24%), Ethiopian (13.3%, a difference of 0.26%), Guamanian/Chamorro (13.3%, a difference of 0.27%), and Immigrants from Albania (13.3%, a difference of 0.27%).
| Demographics | Rating | Rank | Female Poverty |
| Costa Ricans | 63.6 /100 | #159 | Good 13.3% |
| Immigrants | Nepal | 62.7 /100 | #160 | Good 13.3% |
| Immigrants | Ethiopia | 62.5 /100 | #161 | Good 13.3% |
| Guamanians/Chamorros | 62.4 /100 | #162 | Good 13.3% |
| Immigrants | Albania | 62.4 /100 | #163 | Good 13.3% |
| Ethiopians | 62.3 /100 | #164 | Good 13.3% |
| Scotch-Irish | 62.1 /100 | #165 | Good 13.3% |
| Immigrants | Oceania | 59.7 /100 | #166 | Average 13.3% |
| Immigrants | Chile | 57.4 /100 | #167 | Average 13.3% |
| Aleuts | 56.7 /100 | #168 | Average 13.4% |
| Lebanese | 55.9 /100 | #169 | Average 13.4% |
| Colombians | 55.7 /100 | #170 | Average 13.4% |
| Whites/Caucasians | 54.6 /100 | #171 | Average 13.4% |
| Mongolians | 53.6 /100 | #172 | Average 13.4% |
| Immigrants | Afghanistan | 50.8 /100 | #173 | Average 13.4% |
Demographics Similar to Egyptians by Female Poverty
In terms of female poverty, the demographic groups most similar to Egyptians are Serbian (12.3%, a difference of 0.010%), Immigrants from Eastern Europe (12.3%, a difference of 0.040%), Immigrants from North America (12.3%, a difference of 0.070%), Slovak (12.3%, a difference of 0.12%), and Immigrants from Sweden (12.3%, a difference of 0.12%).
| Demographics | Rating | Rank | Female Poverty |
| Carpatho Rusyns | 97.6 /100 | #71 | Exceptional 12.2% |
| Cambodians | 97.5 /100 | #72 | Exceptional 12.2% |
| Zimbabweans | 97.5 /100 | #73 | Exceptional 12.3% |
| Immigrants | Canada | 97.5 /100 | #74 | Exceptional 12.3% |
| Europeans | 97.4 /100 | #75 | Exceptional 12.3% |
| Immigrants | Eastern Europe | 97.2 /100 | #76 | Exceptional 12.3% |
| Serbians | 97.2 /100 | #77 | Exceptional 12.3% |
| Egyptians | 97.2 /100 | #78 | Exceptional 12.3% |
| Immigrants | North America | 97.1 /100 | #79 | Exceptional 12.3% |
| Slovaks | 97.1 /100 | #80 | Exceptional 12.3% |
| Immigrants | Sweden | 97.1 /100 | #81 | Exceptional 12.3% |
| Jordanians | 97.1 /100 | #82 | Exceptional 12.3% |
| Immigrants | England | 96.9 /100 | #83 | Exceptional 12.3% |
| Northern Europeans | 96.6 /100 | #84 | Exceptional 12.4% |
| Irish | 96.5 /100 | #85 | Exceptional 12.4% |