Iranian vs Immigrants from Uganda Hearing Disability
COMPARE
Iranian
Immigrants from Uganda
Hearing Disability
Hearing Disability Comparison
Iranians
Immigrants from Uganda
2.8%
HEARING DISABILITY
96.4/ 100
METRIC RATING
92nd/ 347
METRIC RANK
2.9%
HEARING DISABILITY
86.6/ 100
METRIC RATING
129th/ 347
METRIC RANK
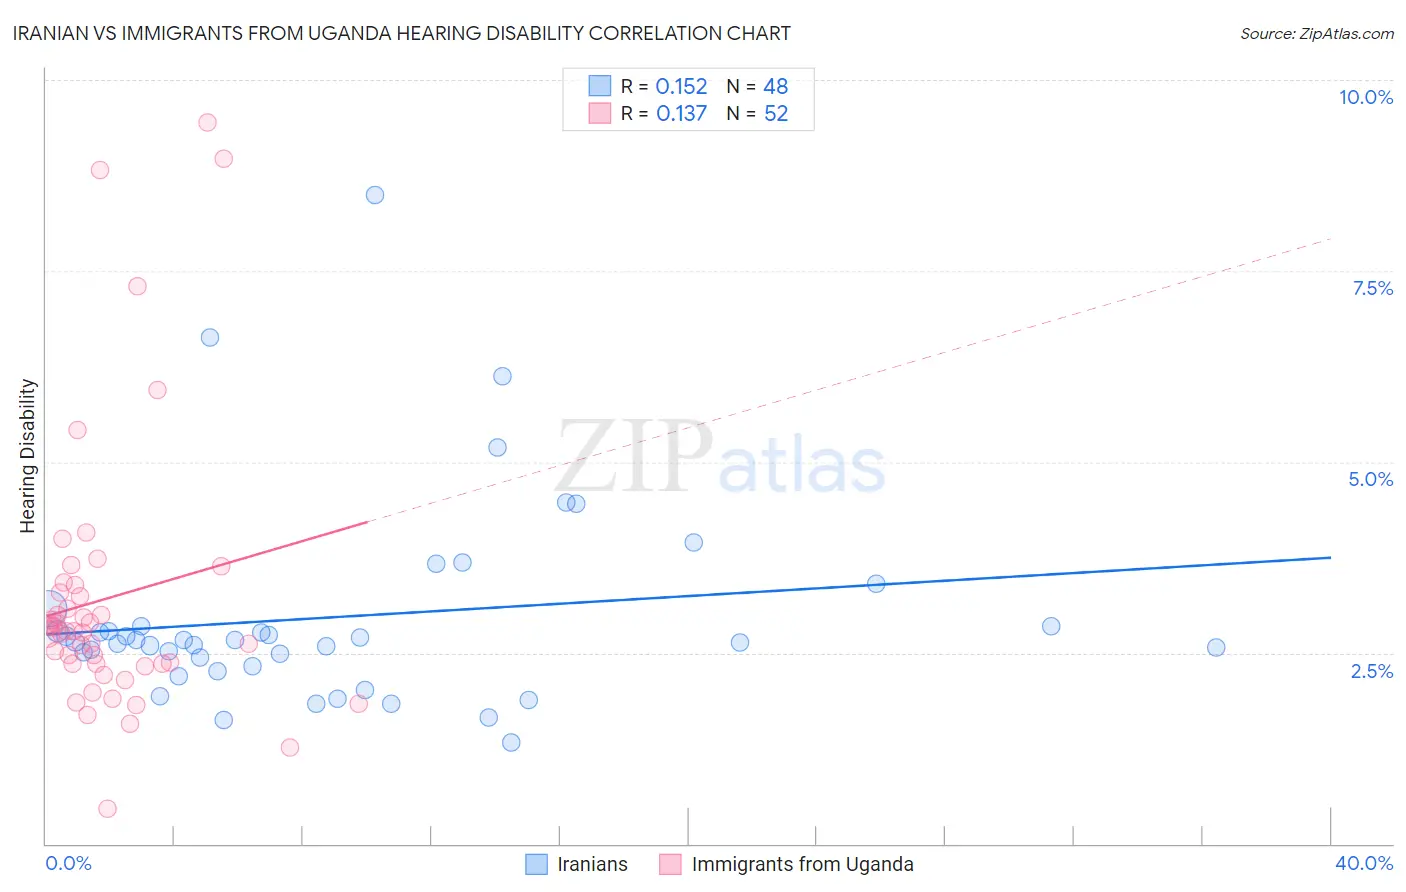
Iranian vs Immigrants from Uganda Hearing Disability Correlation Chart
The statistical analysis conducted on geographies consisting of 316,808,830 people shows a poor positive correlation between the proportion of Iranians and percentage of population with hearing disability in the United States with a correlation coefficient (R) of 0.152 and weighted average of 2.8%. Similarly, the statistical analysis conducted on geographies consisting of 125,979,149 people shows a poor positive correlation between the proportion of Immigrants from Uganda and percentage of population with hearing disability in the United States with a correlation coefficient (R) of 0.137 and weighted average of 2.9%, a difference of 3.6%.
Hearing Disability Correlation Summary
| Measurement | Iranian | Immigrants from Uganda |
| Minimum | 1.3% | 0.45% |
| Maximum | 8.5% | 9.4% |
| Range | 7.2% | 9.0% |
| Mean | 3.0% | 3.2% |
| Median | 2.7% | 2.8% |
| Interquartile 25% (IQ1) | 2.4% | 2.4% |
| Interquartile 75% (IQ3) | 2.8% | 3.3% |
| Interquartile Range (IQR) | 0.46% | 0.98% |
| Standard Deviation (Sample) | 1.3% | 1.8% |
| Standard Deviation (Population) | 1.3% | 1.8% |
Similar Demographics by Hearing Disability
Demographics Similar to Iranians by Hearing Disability
In terms of hearing disability, the demographic groups most similar to Iranians are Immigrants from Middle Africa (2.8%, a difference of 0.030%), Immigrants from Morocco (2.8%, a difference of 0.11%), Immigrants from Kuwait (2.8%, a difference of 0.12%), Belizean (2.8%, a difference of 0.14%), and Immigrants from Turkey (2.8%, a difference of 0.17%).
| Demographics | Rating | Rank | Hearing Disability |
| Immigrants | Northern Africa | 96.9 /100 | #85 | Exceptional 2.8% |
| Immigrants | Iran | 96.8 /100 | #86 | Exceptional 2.8% |
| Somalis | 96.7 /100 | #87 | Exceptional 2.8% |
| Immigrants | Turkey | 96.7 /100 | #88 | Exceptional 2.8% |
| Belizeans | 96.6 /100 | #89 | Exceptional 2.8% |
| Immigrants | Morocco | 96.6 /100 | #90 | Exceptional 2.8% |
| Immigrants | Middle Africa | 96.5 /100 | #91 | Exceptional 2.8% |
| Iranians | 96.4 /100 | #92 | Exceptional 2.8% |
| Immigrants | Kuwait | 96.3 /100 | #93 | Exceptional 2.8% |
| Uruguayans | 95.9 /100 | #94 | Exceptional 2.8% |
| Israelis | 95.9 /100 | #95 | Exceptional 2.8% |
| Immigrants | Somalia | 95.5 /100 | #96 | Exceptional 2.8% |
| Immigrants | Afghanistan | 95.3 /100 | #97 | Exceptional 2.8% |
| Immigrants | Honduras | 95.1 /100 | #98 | Exceptional 2.8% |
| Immigrants | Guatemala | 95.1 /100 | #99 | Exceptional 2.8% |
Demographics Similar to Immigrants from Uganda by Hearing Disability
In terms of hearing disability, the demographic groups most similar to Immigrants from Uganda are Immigrants from Vietnam (2.9%, a difference of 0.020%), South American Indian (2.9%, a difference of 0.050%), Immigrants from Western Asia (2.9%, a difference of 0.050%), Immigrants from Kenya (2.9%, a difference of 0.10%), and Chilean (2.9%, a difference of 0.16%).
| Demographics | Rating | Rank | Hearing Disability |
| Liberians | 89.0 /100 | #122 | Excellent 2.8% |
| Immigrants | Zaire | 88.6 /100 | #123 | Excellent 2.9% |
| Bahamians | 88.6 /100 | #124 | Excellent 2.9% |
| Immigrants | Albania | 88.5 /100 | #125 | Excellent 2.9% |
| Immigrants | Sudan | 87.8 /100 | #126 | Excellent 2.9% |
| South American Indians | 86.9 /100 | #127 | Excellent 2.9% |
| Immigrants | Western Asia | 86.9 /100 | #128 | Excellent 2.9% |
| Immigrants | Uganda | 86.6 /100 | #129 | Excellent 2.9% |
| Immigrants | Vietnam | 86.5 /100 | #130 | Excellent 2.9% |
| Immigrants | Kenya | 86.1 /100 | #131 | Excellent 2.9% |
| Chileans | 85.8 /100 | #132 | Excellent 2.9% |
| Immigrants | Syria | 85.8 /100 | #133 | Excellent 2.9% |
| Ugandans | 85.5 /100 | #134 | Excellent 2.9% |
| Soviet Union | 84.8 /100 | #135 | Excellent 2.9% |
| Immigrants | Brazil | 84.6 /100 | #136 | Excellent 2.9% |