Iranian vs Immigrants from Uganda Disability Age Under 5
COMPARE
Iranian
Immigrants from Uganda
Disability Age Under 5
Disability Age Under 5 Comparison
Iranians
Immigrants from Uganda
1.0%
DISABILITY AGE UNDER 5
99.9/ 100
METRIC RATING
32nd/ 347
METRIC RANK
1.1%
DISABILITY AGE UNDER 5
96.1/ 100
METRIC RATING
101st/ 347
METRIC RANK
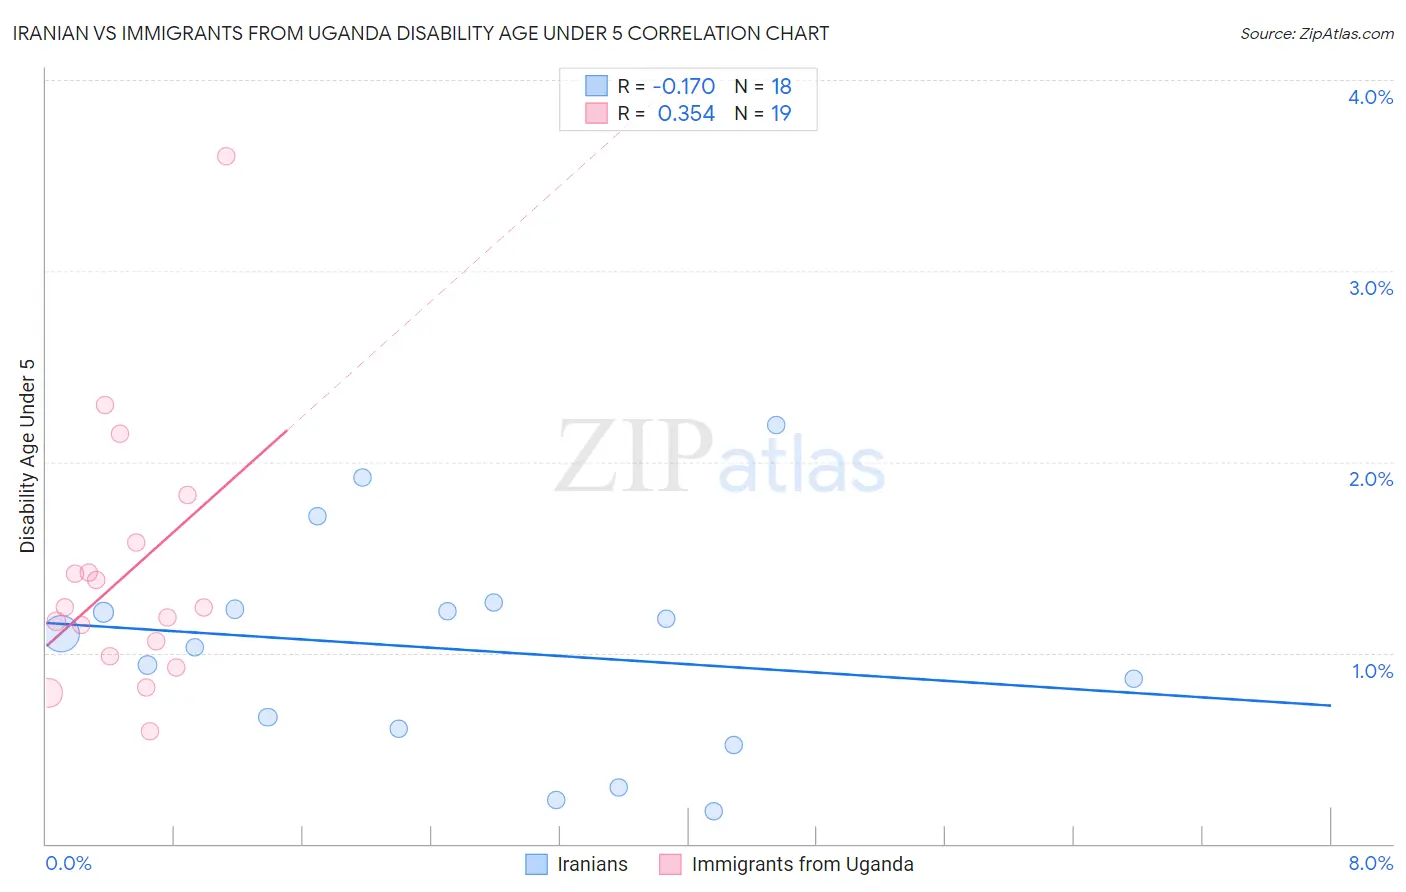
Iranian vs Immigrants from Uganda Disability Age Under 5 Correlation Chart
The statistical analysis conducted on geographies consisting of 185,162,797 people shows a poor negative correlation between the proportion of Iranians and percentage of population with a disability under the age of 5 in the United States with a correlation coefficient (R) of -0.170 and weighted average of 1.0%. Similarly, the statistical analysis conducted on geographies consisting of 93,852,660 people shows a mild positive correlation between the proportion of Immigrants from Uganda and percentage of population with a disability under the age of 5 in the United States with a correlation coefficient (R) of 0.354 and weighted average of 1.1%, a difference of 11.5%.
Disability Age Under 5 Correlation Summary
| Measurement | Iranian | Immigrants from Uganda |
| Minimum | 0.17% | 0.59% |
| Maximum | 2.2% | 3.6% |
| Range | 2.0% | 3.0% |
| Mean | 1.0% | 1.4% |
| Median | 1.1% | 1.2% |
| Interquartile 25% (IQ1) | 0.60% | 0.98% |
| Interquartile 75% (IQ3) | 1.2% | 1.6% |
| Interquartile Range (IQR) | 0.63% | 0.59% |
| Standard Deviation (Sample) | 0.56% | 0.69% |
| Standard Deviation (Population) | 0.54% | 0.67% |
Similar Demographics by Disability Age Under 5
Demographics Similar to Iranians by Disability Age Under 5
In terms of disability age under 5, the demographic groups most similar to Iranians are Armenian (1.0%, a difference of 0.050%), Bolivian (1.0%, a difference of 0.17%), Immigrants from Ukraine (1.0%, a difference of 0.29%), Immigrants from South Central Asia (1.0%, a difference of 0.33%), and Barbadian (1.0%, a difference of 0.53%).
| Demographics | Rating | Rank | Disability Age Under 5 |
| Immigrants | Micronesia | 100.0 /100 | #25 | Exceptional 1.0% |
| Immigrants | Taiwan | 100.0 /100 | #26 | Exceptional 1.0% |
| Guyanese | 100.0 /100 | #27 | Exceptional 1.0% |
| Immigrants | Eastern Asia | 100.0 /100 | #28 | Exceptional 1.0% |
| Immigrants | Belarus | 100.0 /100 | #29 | Exceptional 1.0% |
| Immigrants | South Central Asia | 99.9 /100 | #30 | Exceptional 1.0% |
| Armenians | 99.9 /100 | #31 | Exceptional 1.0% |
| Iranians | 99.9 /100 | #32 | Exceptional 1.0% |
| Bolivians | 99.9 /100 | #33 | Exceptional 1.0% |
| Immigrants | Ukraine | 99.9 /100 | #34 | Exceptional 1.0% |
| Barbadians | 99.9 /100 | #35 | Exceptional 1.0% |
| Immigrants | Nepal | 99.9 /100 | #36 | Exceptional 1.0% |
| Immigrants | India | 99.9 /100 | #37 | Exceptional 1.0% |
| Immigrants | Guyana | 99.9 /100 | #38 | Exceptional 1.0% |
| Filipinos | 99.9 /100 | #39 | Exceptional 1.1% |
Demographics Similar to Immigrants from Uganda by Disability Age Under 5
In terms of disability age under 5, the demographic groups most similar to Immigrants from Uganda are Immigrants from Morocco (1.2%, a difference of 0.060%), Immigrants from Nicaragua (1.2%, a difference of 0.060%), Nicaraguan (1.1%, a difference of 0.11%), Indonesian (1.2%, a difference of 0.12%), and Dominican (1.1%, a difference of 0.14%).
| Demographics | Rating | Rank | Disability Age Under 5 |
| Sri Lankans | 96.8 /100 | #94 | Exceptional 1.1% |
| Immigrants | Moldova | 96.8 /100 | #95 | Exceptional 1.1% |
| Mongolians | 96.6 /100 | #96 | Exceptional 1.1% |
| Immigrants | Iraq | 96.5 /100 | #97 | Exceptional 1.1% |
| Immigrants | South Eastern Asia | 96.5 /100 | #98 | Exceptional 1.1% |
| Dominicans | 96.3 /100 | #99 | Exceptional 1.1% |
| Nicaraguans | 96.3 /100 | #100 | Exceptional 1.1% |
| Immigrants | Uganda | 96.1 /100 | #101 | Exceptional 1.1% |
| Immigrants | Morocco | 96.0 /100 | #102 | Exceptional 1.2% |
| Immigrants | Nicaragua | 96.0 /100 | #103 | Exceptional 1.2% |
| Indonesians | 95.9 /100 | #104 | Exceptional 1.2% |
| Immigrants | South Africa | 95.6 /100 | #105 | Exceptional 1.2% |
| Cambodians | 95.4 /100 | #106 | Exceptional 1.2% |
| Immigrants | West Indies | 95.3 /100 | #107 | Exceptional 1.2% |
| Iraqis | 95.1 /100 | #108 | Exceptional 1.2% |