Indonesian vs Bangladeshi Births to Unmarried Women
COMPARE
Indonesian
Bangladeshi
Births to Unmarried Women
Births to Unmarried Women Comparison
Indonesians
Bangladeshis
35.0%
BIRTHS TO UNMARRIED WOMEN
1.2/ 100
METRIC RATING
242nd/ 347
METRIC RANK
34.4%
BIRTHS TO UNMARRIED WOMEN
2.5/ 100
METRIC RATING
233rd/ 347
METRIC RANK
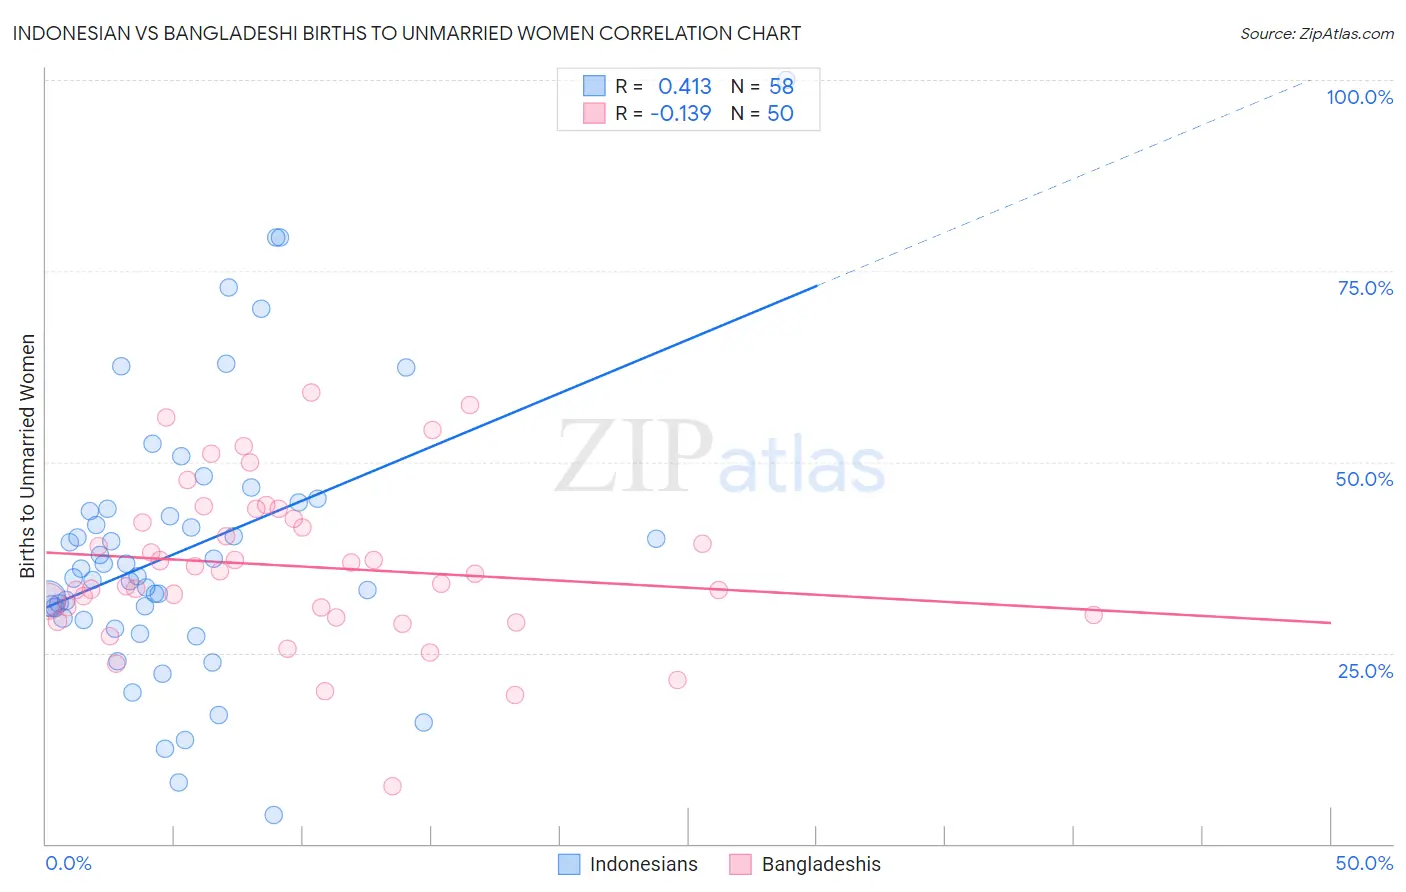
Indonesian vs Bangladeshi Births to Unmarried Women Correlation Chart
The statistical analysis conducted on geographies consisting of 158,009,570 people shows a moderate positive correlation between the proportion of Indonesians and percentage of births to unmarried women in the United States with a correlation coefficient (R) of 0.413 and weighted average of 35.0%. Similarly, the statistical analysis conducted on geographies consisting of 137,729,923 people shows a poor negative correlation between the proportion of Bangladeshis and percentage of births to unmarried women in the United States with a correlation coefficient (R) of -0.139 and weighted average of 34.4%, a difference of 1.7%.
Births to Unmarried Women Correlation Summary
| Measurement | Indonesian | Bangladeshi |
| Minimum | 3.8% | 7.6% |
| Maximum | 100.0% | 59.1% |
| Range | 96.2% | 51.5% |
| Mean | 38.6% | 36.4% |
| Median | 35.5% | 35.5% |
| Interquartile 25% (IQ1) | 29.6% | 30.0% |
| Interquartile 75% (IQ3) | 43.8% | 42.6% |
| Interquartile Range (IQR) | 14.2% | 12.6% |
| Standard Deviation (Sample) | 17.8% | 10.4% |
| Standard Deviation (Population) | 17.7% | 10.3% |
Demographics Similar to Indonesians and Bangladeshis by Births to Unmarried Women
In terms of births to unmarried women, the demographic groups most similar to Indonesians are Immigrants from Guyana (35.0%, a difference of 0.10%), Immigrants from Middle Africa (34.9%, a difference of 0.13%), Sierra Leonean (34.9%, a difference of 0.38%), Japanese (35.2%, a difference of 0.49%), and Guyanese (35.2%, a difference of 0.55%). Similarly, the demographic groups most similar to Bangladeshis are French Canadian (34.4%, a difference of 0.020%), Immigrants from Zaire (34.5%, a difference of 0.24%), Native Hawaiian (34.3%, a difference of 0.31%), Immigrants from Ghana (34.5%, a difference of 0.31%), and Ghanaian (34.3%, a difference of 0.46%).
| Demographics | Rating | Rank | Births to Unmarried Women |
| Immigrants | Panama | 3.3 /100 | #227 | Tragic 34.2% |
| Panamanians | 3.3 /100 | #228 | Tragic 34.2% |
| Immigrants | Sierra Leone | 3.1 /100 | #229 | Tragic 34.2% |
| Ghanaians | 3.1 /100 | #230 | Tragic 34.3% |
| Native Hawaiians | 2.9 /100 | #231 | Tragic 34.3% |
| French Canadians | 2.5 /100 | #232 | Tragic 34.4% |
| Bangladeshis | 2.5 /100 | #233 | Tragic 34.4% |
| Immigrants | Zaire | 2.3 /100 | #234 | Tragic 34.5% |
| Immigrants | Ghana | 2.2 /100 | #235 | Tragic 34.5% |
| Immigrants | Cameroon | 1.6 /100 | #236 | Tragic 34.7% |
| Marshallese | 1.6 /100 | #237 | Tragic 34.8% |
| Immigrants | Cambodia | 1.6 /100 | #238 | Tragic 34.8% |
| Sierra Leoneans | 1.4 /100 | #239 | Tragic 34.9% |
| Immigrants | Middle Africa | 1.2 /100 | #240 | Tragic 34.9% |
| Immigrants | Guyana | 1.2 /100 | #241 | Tragic 35.0% |
| Indonesians | 1.2 /100 | #242 | Tragic 35.0% |
| Japanese | 0.9 /100 | #243 | Tragic 35.2% |
| Guyanese | 0.9 /100 | #244 | Tragic 35.2% |
| Shoshone | 0.8 /100 | #245 | Tragic 35.3% |
| Nigerians | 0.7 /100 | #246 | Tragic 35.3% |
| Immigrants | Nigeria | 0.7 /100 | #247 | Tragic 35.4% |