Immigrants from Uruguay vs Comanche Married-Couple Family Poverty
COMPARE
Immigrants from Uruguay
Comanche
Married-Couple Family Poverty
Married-Couple Family Poverty Comparison
Immigrants from Uruguay
Comanche
5.7%
MARRIED-COUPLE FAMILY POVERTY
3.7/ 100
METRIC RATING
234th/ 347
METRIC RANK
6.0%
MARRIED-COUPLE FAMILY POVERTY
0.7/ 100
METRIC RATING
255th/ 347
METRIC RANK
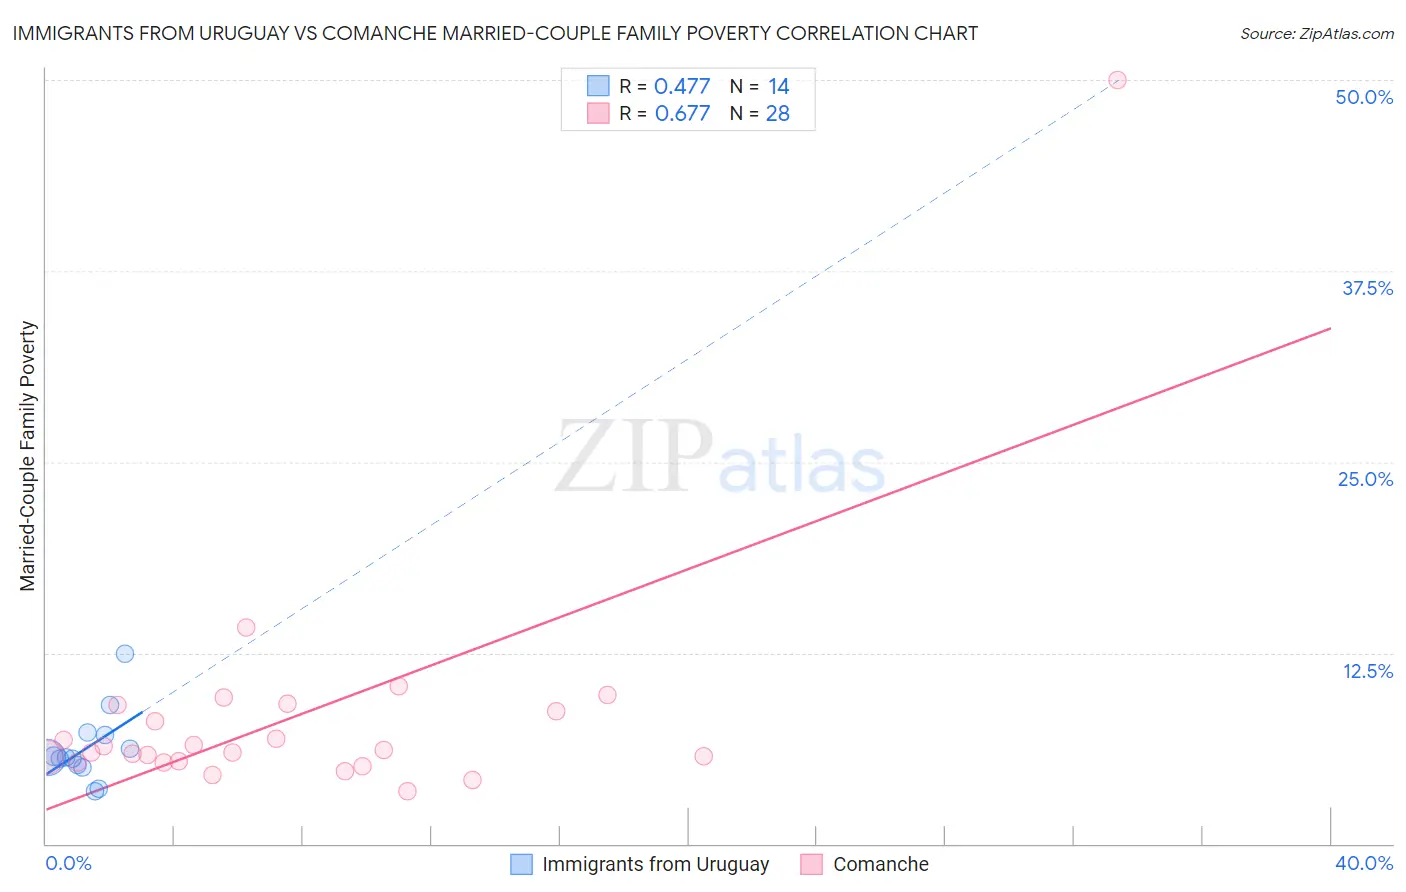
Immigrants from Uruguay vs Comanche Married-Couple Family Poverty Correlation Chart
The statistical analysis conducted on geographies consisting of 132,847,236 people shows a moderate positive correlation between the proportion of Immigrants from Uruguay and poverty level among married-couple families in the United States with a correlation coefficient (R) of 0.477 and weighted average of 5.7%. Similarly, the statistical analysis conducted on geographies consisting of 109,532,955 people shows a significant positive correlation between the proportion of Comanche and poverty level among married-couple families in the United States with a correlation coefficient (R) of 0.677 and weighted average of 6.0%, a difference of 4.6%.
Married-Couple Family Poverty Correlation Summary
| Measurement | Immigrants from Uruguay | Comanche |
| Minimum | 3.4% | 3.4% |
| Maximum | 12.4% | 50.0% |
| Range | 9.0% | 46.6% |
| Mean | 6.3% | 8.4% |
| Median | 5.7% | 6.0% |
| Interquartile 25% (IQ1) | 5.2% | 5.4% |
| Interquartile 75% (IQ3) | 7.2% | 8.9% |
| Interquartile Range (IQR) | 2.0% | 3.5% |
| Standard Deviation (Sample) | 2.3% | 8.5% |
| Standard Deviation (Population) | 2.2% | 8.3% |
Similar Demographics by Married-Couple Family Poverty
Demographics Similar to Immigrants from Uruguay by Married-Couple Family Poverty
In terms of married-couple family poverty, the demographic groups most similar to Immigrants from Uruguay are Immigrants from Colombia (5.7%, a difference of 0.010%), Immigrants from Sudan (5.7%, a difference of 0.19%), Ghanaian (5.7%, a difference of 0.35%), Immigrants from Laos (5.7%, a difference of 0.44%), and Immigrants from Iraq (5.7%, a difference of 0.50%).
| Demographics | Rating | Rank | Married-Couple Family Poverty |
| Immigrants | Zaire | 5.6 /100 | #227 | Tragic 5.6% |
| Arabs | 5.4 /100 | #228 | Tragic 5.7% |
| Sub-Saharan Africans | 4.9 /100 | #229 | Tragic 5.7% |
| Moroccans | 4.9 /100 | #230 | Tragic 5.7% |
| Immigrants | Iraq | 4.4 /100 | #231 | Tragic 5.7% |
| Immigrants | Laos | 4.4 /100 | #232 | Tragic 5.7% |
| Immigrants | Colombia | 3.7 /100 | #233 | Tragic 5.7% |
| Immigrants | Uruguay | 3.7 /100 | #234 | Tragic 5.7% |
| Immigrants | Sudan | 3.5 /100 | #235 | Tragic 5.7% |
| Ghanaians | 3.3 /100 | #236 | Tragic 5.7% |
| Immigrants | South America | 3.1 /100 | #237 | Tragic 5.7% |
| Cherokee | 2.7 /100 | #238 | Tragic 5.8% |
| Venezuelans | 2.7 /100 | #239 | Tragic 5.8% |
| Fijians | 2.5 /100 | #240 | Tragic 5.8% |
| Immigrants | Panama | 2.5 /100 | #241 | Tragic 5.8% |
Demographics Similar to Comanche by Married-Couple Family Poverty
In terms of married-couple family poverty, the demographic groups most similar to Comanche are Immigrants from Somalia (6.0%, a difference of 0.15%), African (6.0%, a difference of 0.21%), Immigrants from Western Asia (6.0%, a difference of 0.30%), Bangladeshi (6.0%, a difference of 0.50%), and Immigrants from Burma/Myanmar (6.0%, a difference of 0.74%).
| Demographics | Rating | Rank | Married-Couple Family Poverty |
| Cree | 1.2 /100 | #248 | Tragic 5.9% |
| Tsimshian | 1.1 /100 | #249 | Tragic 5.9% |
| Immigrants | Eritrea | 1.1 /100 | #250 | Tragic 5.9% |
| Immigrants | Ghana | 1.0 /100 | #251 | Tragic 5.9% |
| Immigrants | Western Asia | 0.7 /100 | #252 | Tragic 6.0% |
| Africans | 0.7 /100 | #253 | Tragic 6.0% |
| Immigrants | Somalia | 0.7 /100 | #254 | Tragic 6.0% |
| Comanche | 0.7 /100 | #255 | Tragic 6.0% |
| Bangladeshis | 0.5 /100 | #256 | Tragic 6.0% |
| Immigrants | Burma/Myanmar | 0.5 /100 | #257 | Tragic 6.0% |
| Immigrants | Immigrants | 0.5 /100 | #258 | Tragic 6.0% |
| Alaskan Athabascans | 0.4 /100 | #259 | Tragic 6.1% |
| Jamaicans | 0.3 /100 | #260 | Tragic 6.1% |
| Senegalese | 0.3 /100 | #261 | Tragic 6.1% |
| Shoshone | 0.3 /100 | #262 | Tragic 6.1% |