Immigrants from Czechoslovakia vs Comanche Married-Couple Family Poverty
COMPARE
Immigrants from Czechoslovakia
Comanche
Married-Couple Family Poverty
Married-Couple Family Poverty Comparison
Immigrants from Czechoslovakia
Comanche
4.6%
MARRIED-COUPLE FAMILY POVERTY
98.5/ 100
METRIC RATING
89th/ 347
METRIC RANK
6.0%
MARRIED-COUPLE FAMILY POVERTY
0.7/ 100
METRIC RATING
255th/ 347
METRIC RANK
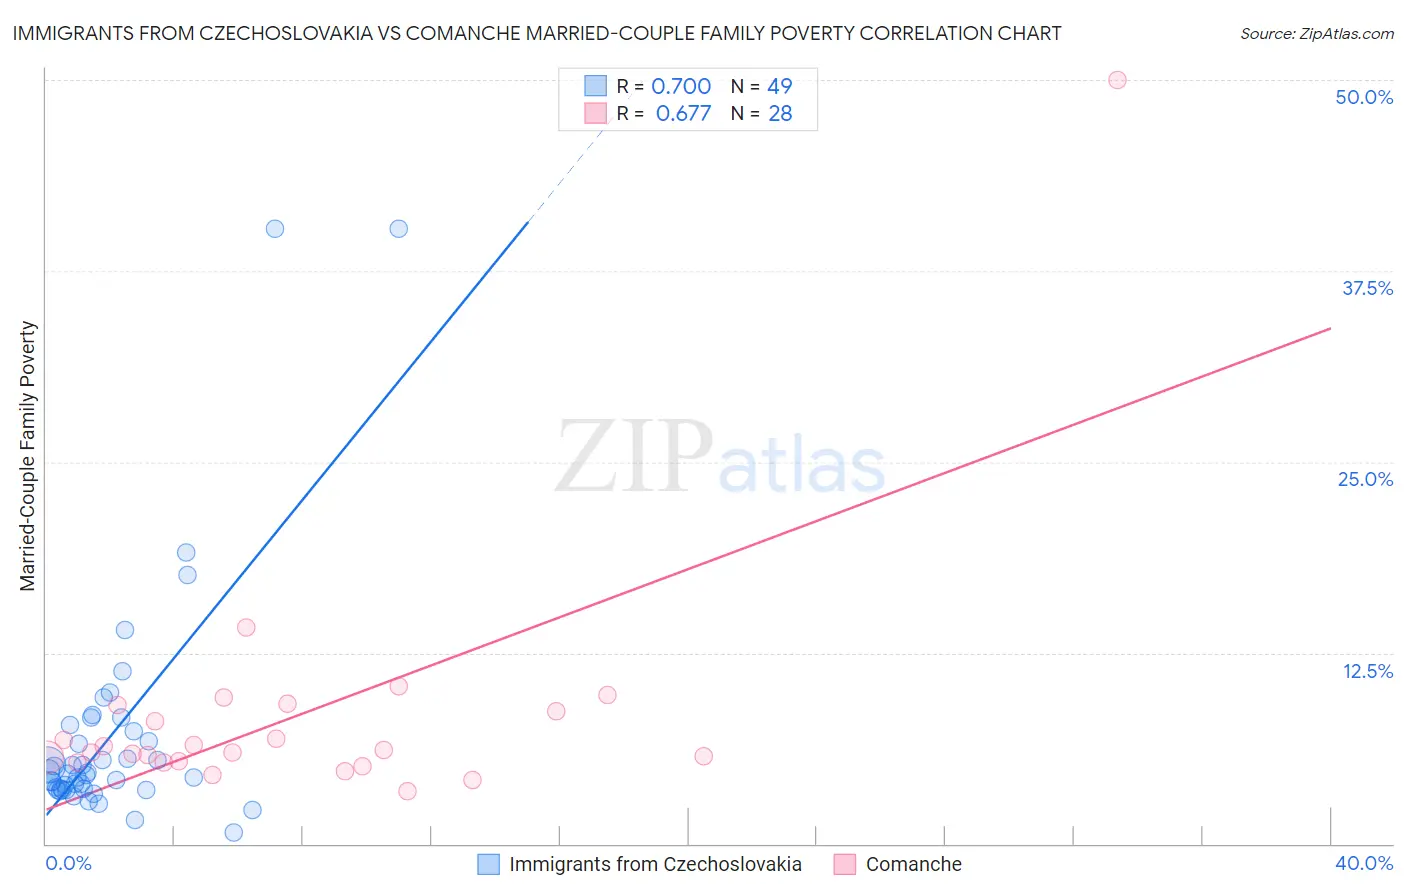
Immigrants from Czechoslovakia vs Comanche Married-Couple Family Poverty Correlation Chart
The statistical analysis conducted on geographies consisting of 194,643,621 people shows a significant positive correlation between the proportion of Immigrants from Czechoslovakia and poverty level among married-couple families in the United States with a correlation coefficient (R) of 0.700 and weighted average of 4.6%. Similarly, the statistical analysis conducted on geographies consisting of 109,532,955 people shows a significant positive correlation between the proportion of Comanche and poverty level among married-couple families in the United States with a correlation coefficient (R) of 0.677 and weighted average of 6.0%, a difference of 30.4%.
Married-Couple Family Poverty Correlation Summary
| Measurement | Immigrants from Czechoslovakia | Comanche |
| Minimum | 0.74% | 3.4% |
| Maximum | 40.3% | 50.0% |
| Range | 39.5% | 46.6% |
| Mean | 7.1% | 8.4% |
| Median | 4.6% | 6.0% |
| Interquartile 25% (IQ1) | 3.6% | 5.4% |
| Interquartile 75% (IQ3) | 7.5% | 8.9% |
| Interquartile Range (IQR) | 4.0% | 3.5% |
| Standard Deviation (Sample) | 7.8% | 8.5% |
| Standard Deviation (Population) | 7.7% | 8.3% |
Similar Demographics by Married-Couple Family Poverty
Demographics Similar to Immigrants from Czechoslovakia by Married-Couple Family Poverty
In terms of married-couple family poverty, the demographic groups most similar to Immigrants from Czechoslovakia are Immigrants from Switzerland (4.6%, a difference of 0.070%), Bolivian (4.6%, a difference of 0.11%), Basque (4.6%, a difference of 0.11%), Immigrants from Norway (4.6%, a difference of 0.18%), and Immigrants from North Macedonia (4.6%, a difference of 0.21%).
| Demographics | Rating | Rank | Married-Couple Family Poverty |
| Canadians | 98.8 /100 | #82 | Exceptional 4.5% |
| Immigrants | Denmark | 98.8 /100 | #83 | Exceptional 4.6% |
| Immigrants | Croatia | 98.7 /100 | #84 | Exceptional 4.6% |
| South Africans | 98.7 /100 | #85 | Exceptional 4.6% |
| Immigrants | Turkey | 98.6 /100 | #86 | Exceptional 4.6% |
| Immigrants | North Macedonia | 98.6 /100 | #87 | Exceptional 4.6% |
| Bolivians | 98.6 /100 | #88 | Exceptional 4.6% |
| Immigrants | Czechoslovakia | 98.5 /100 | #89 | Exceptional 4.6% |
| Immigrants | Switzerland | 98.5 /100 | #90 | Exceptional 4.6% |
| Basques | 98.5 /100 | #91 | Exceptional 4.6% |
| Immigrants | Norway | 98.4 /100 | #92 | Exceptional 4.6% |
| Koreans | 98.3 /100 | #93 | Exceptional 4.6% |
| Immigrants | Italy | 98.3 /100 | #94 | Exceptional 4.6% |
| Portuguese | 98.3 /100 | #95 | Exceptional 4.6% |
| Immigrants | Poland | 98.3 /100 | #96 | Exceptional 4.6% |
Demographics Similar to Comanche by Married-Couple Family Poverty
In terms of married-couple family poverty, the demographic groups most similar to Comanche are Immigrants from Somalia (6.0%, a difference of 0.15%), African (6.0%, a difference of 0.21%), Immigrants from Western Asia (6.0%, a difference of 0.30%), Bangladeshi (6.0%, a difference of 0.50%), and Immigrants from Burma/Myanmar (6.0%, a difference of 0.74%).
| Demographics | Rating | Rank | Married-Couple Family Poverty |
| Cree | 1.2 /100 | #248 | Tragic 5.9% |
| Tsimshian | 1.1 /100 | #249 | Tragic 5.9% |
| Immigrants | Eritrea | 1.1 /100 | #250 | Tragic 5.9% |
| Immigrants | Ghana | 1.0 /100 | #251 | Tragic 5.9% |
| Immigrants | Western Asia | 0.7 /100 | #252 | Tragic 6.0% |
| Africans | 0.7 /100 | #253 | Tragic 6.0% |
| Immigrants | Somalia | 0.7 /100 | #254 | Tragic 6.0% |
| Comanche | 0.7 /100 | #255 | Tragic 6.0% |
| Bangladeshis | 0.5 /100 | #256 | Tragic 6.0% |
| Immigrants | Burma/Myanmar | 0.5 /100 | #257 | Tragic 6.0% |
| Immigrants | Immigrants | 0.5 /100 | #258 | Tragic 6.0% |
| Alaskan Athabascans | 0.4 /100 | #259 | Tragic 6.1% |
| Jamaicans | 0.3 /100 | #260 | Tragic 6.1% |
| Senegalese | 0.3 /100 | #261 | Tragic 6.1% |
| Shoshone | 0.3 /100 | #262 | Tragic 6.1% |