Immigrants from Uruguay vs Comanche Family Poverty
COMPARE
Immigrants from Uruguay
Comanche
Family Poverty
Family Poverty Comparison
Immigrants from Uruguay
Comanche
9.5%
FAMILY POVERTY
14.0/ 100
METRIC RATING
209th/ 347
METRIC RANK
11.0%
FAMILY POVERTY
0.1/ 100
METRIC RATING
267th/ 347
METRIC RANK
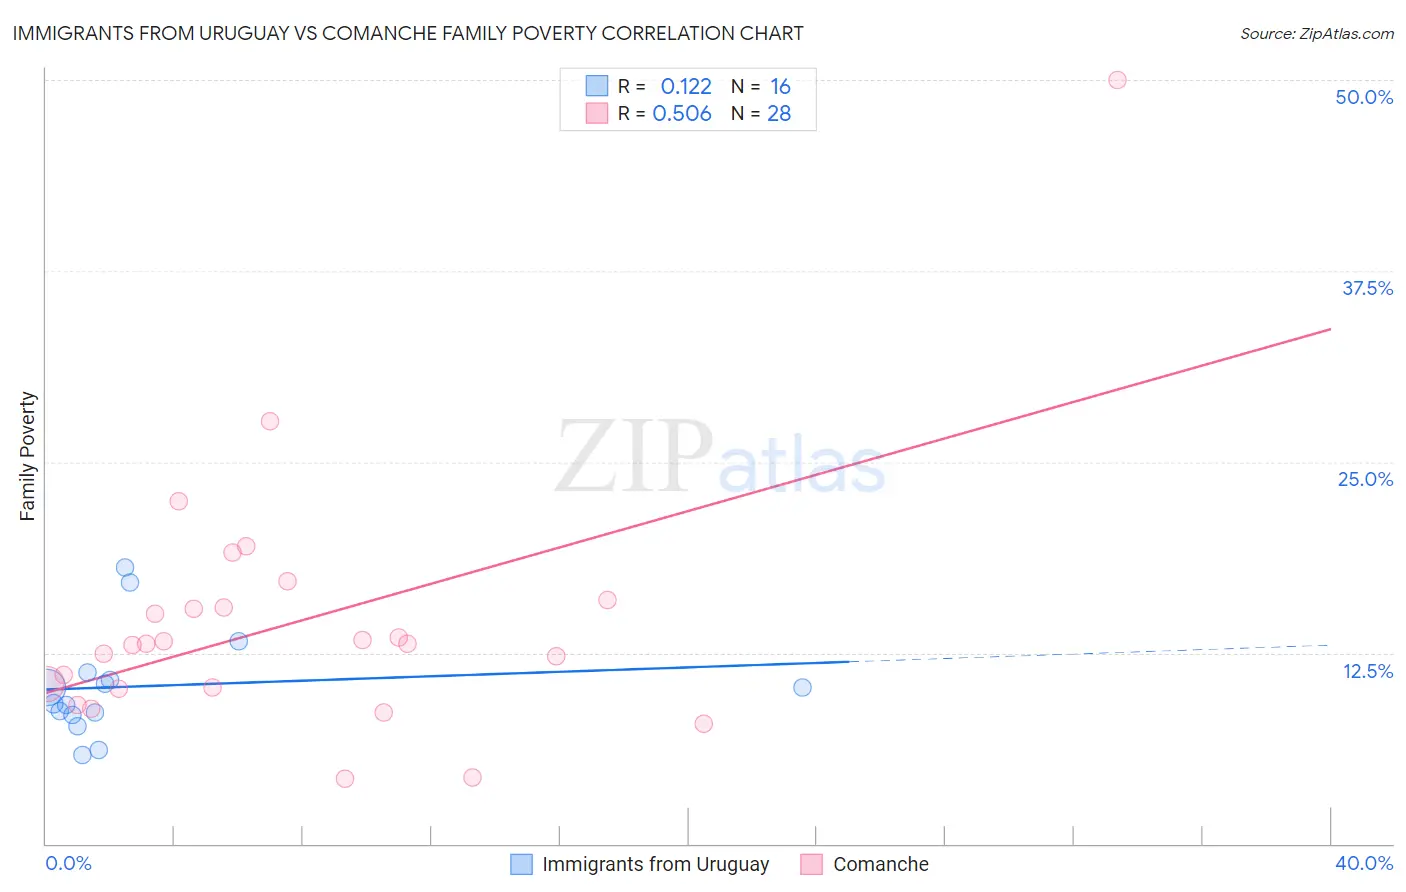
Immigrants from Uruguay vs Comanche Family Poverty Correlation Chart
The statistical analysis conducted on geographies consisting of 133,161,280 people shows a poor positive correlation between the proportion of Immigrants from Uruguay and poverty level among families in the United States with a correlation coefficient (R) of 0.122 and weighted average of 9.5%. Similarly, the statistical analysis conducted on geographies consisting of 109,722,823 people shows a substantial positive correlation between the proportion of Comanche and poverty level among families in the United States with a correlation coefficient (R) of 0.506 and weighted average of 11.0%, a difference of 15.8%.
Family Poverty Correlation Summary
| Measurement | Immigrants from Uruguay | Comanche |
| Minimum | 5.8% | 4.3% |
| Maximum | 18.1% | 50.0% |
| Range | 12.2% | 45.7% |
| Mean | 10.3% | 14.5% |
| Median | 9.7% | 13.1% |
| Interquartile 25% (IQ1) | 8.5% | 10.2% |
| Interquartile 75% (IQ3) | 11.0% | 15.7% |
| Interquartile Range (IQR) | 2.5% | 5.5% |
| Standard Deviation (Sample) | 3.4% | 8.6% |
| Standard Deviation (Population) | 3.3% | 8.4% |
Similar Demographics by Family Poverty
Demographics Similar to Immigrants from Uruguay by Family Poverty
In terms of family poverty, the demographic groups most similar to Immigrants from Uruguay are Immigrants from Eastern Africa (9.5%, a difference of 0.29%), Sierra Leonean (9.5%, a difference of 0.40%), Alsatian (9.6%, a difference of 0.73%), Immigrants from South America (9.5%, a difference of 0.93%), and Aleut (9.5%, a difference of 0.94%).
| Demographics | Rating | Rank | Family Poverty |
| Immigrants | Sierra Leone | 19.6 /100 | #202 | Poor 9.4% |
| German Russians | 19.4 /100 | #203 | Poor 9.4% |
| Immigrants | Lebanon | 18.9 /100 | #204 | Poor 9.4% |
| Aleuts | 18.0 /100 | #205 | Poor 9.5% |
| Immigrants | South America | 18.0 /100 | #206 | Poor 9.5% |
| Sierra Leoneans | 15.6 /100 | #207 | Poor 9.5% |
| Immigrants | Eastern Africa | 15.1 /100 | #208 | Poor 9.5% |
| Immigrants | Uruguay | 14.0 /100 | #209 | Poor 9.5% |
| Alsatians | 11.3 /100 | #210 | Poor 9.6% |
| Malaysians | 10.6 /100 | #211 | Poor 9.6% |
| Immigrants | Thailand | 9.7 /100 | #212 | Tragic 9.7% |
| Osage | 8.0 /100 | #213 | Tragic 9.7% |
| Immigrants | Micronesia | 6.7 /100 | #214 | Tragic 9.8% |
| Immigrants | Nonimmigrants | 6.7 /100 | #215 | Tragic 9.8% |
| Moroccans | 6.5 /100 | #216 | Tragic 9.8% |
Demographics Similar to Comanche by Family Poverty
In terms of family poverty, the demographic groups most similar to Comanche are Immigrants from El Salvador (11.0%, a difference of 0.010%), Jamaican (11.1%, a difference of 0.10%), Immigrants from Ecuador (11.1%, a difference of 0.58%), Immigrants from Nicaragua (11.1%, a difference of 0.59%), and Immigrants from Bahamas (11.1%, a difference of 0.84%).
| Demographics | Rating | Rank | Family Poverty |
| Bangladeshis | 0.2 /100 | #260 | Tragic 10.9% |
| Shoshone | 0.2 /100 | #261 | Tragic 10.9% |
| Spanish American Indians | 0.2 /100 | #262 | Tragic 10.9% |
| Cape Verdeans | 0.1 /100 | #263 | Tragic 10.9% |
| Trinidadians and Tobagonians | 0.1 /100 | #264 | Tragic 10.9% |
| Immigrants | Trinidad and Tobago | 0.1 /100 | #265 | Tragic 10.9% |
| Immigrants | El Salvador | 0.1 /100 | #266 | Tragic 11.0% |
| Comanche | 0.1 /100 | #267 | Tragic 11.0% |
| Jamaicans | 0.1 /100 | #268 | Tragic 11.1% |
| Immigrants | Ecuador | 0.1 /100 | #269 | Tragic 11.1% |
| Immigrants | Nicaragua | 0.1 /100 | #270 | Tragic 11.1% |
| Immigrants | Bahamas | 0.1 /100 | #271 | Tragic 11.1% |
| Immigrants | Jamaica | 0.1 /100 | #272 | Tragic 11.2% |
| Somalis | 0.1 /100 | #273 | Tragic 11.2% |
| Spanish Americans | 0.1 /100 | #274 | Tragic 11.2% |