Immigrants from Uruguay vs Comanche Average Family Size
COMPARE
Immigrants from Uruguay
Comanche
Average Family Size
Average Family Size Comparison
Immigrants from Uruguay
Comanche
3.23
AVERAGE FAMILY SIZE
52.0/ 100
METRIC RATING
173rd/ 347
METRIC RANK
3.25
AVERAGE FAMILY SIZE
82.8/ 100
METRIC RATING
136th/ 347
METRIC RANK
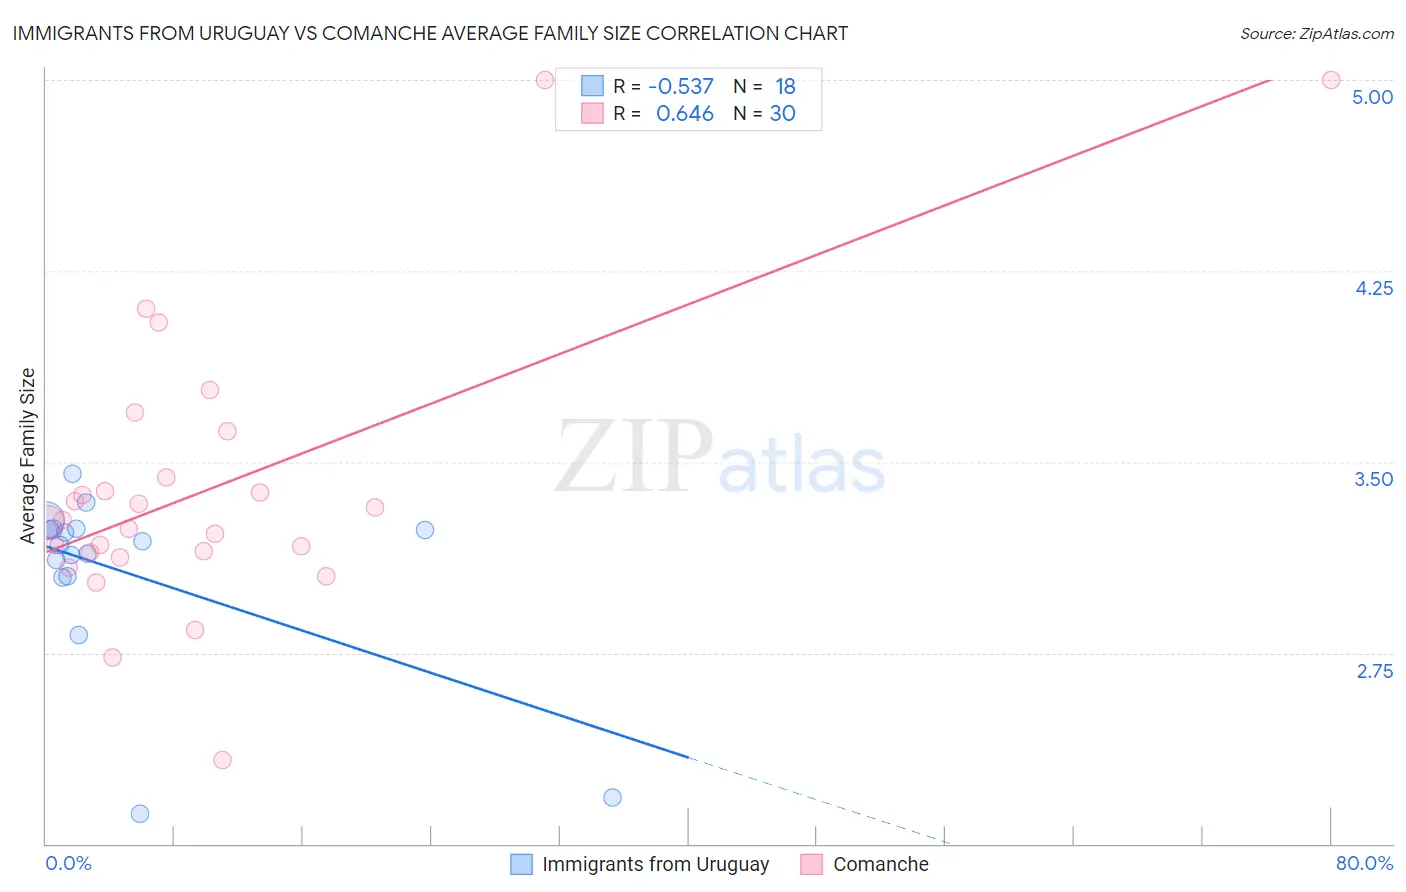
Immigrants from Uruguay vs Comanche Average Family Size Correlation Chart
The statistical analysis conducted on geographies consisting of 133,245,142 people shows a substantial negative correlation between the proportion of Immigrants from Uruguay and average family size in the United States with a correlation coefficient (R) of -0.537 and weighted average of 3.23. Similarly, the statistical analysis conducted on geographies consisting of 109,768,094 people shows a significant positive correlation between the proportion of Comanche and average family size in the United States with a correlation coefficient (R) of 0.646 and weighted average of 3.25, a difference of 0.68%.
Average Family Size Correlation Summary
| Measurement | Immigrants from Uruguay | Comanche |
| Minimum | 2.12 | 2.33 |
| Maximum | 3.46 | 5.00 |
| Range | 1.34 | 2.67 |
| Mean | 3.07 | 3.39 |
| Median | 3.18 | 3.27 |
| Interquartile 25% (IQ1) | 3.05 | 3.14 |
| Interquartile 75% (IQ3) | 3.24 | 3.44 |
| Interquartile Range (IQR) | 0.19 | 0.30 |
| Standard Deviation (Sample) | 0.36 | 0.56 |
| Standard Deviation (Population) | 0.35 | 0.55 |
Similar Demographics by Average Family Size
Demographics Similar to Immigrants from Uruguay by Average Family Size
In terms of average family size, the demographic groups most similar to Immigrants from Uruguay are Immigrants from Congo (3.23, a difference of 0.010%), Chilean (3.23, a difference of 0.020%), Arab (3.23, a difference of 0.030%), Taiwanese (3.23, a difference of 0.040%), and Aleut (3.23, a difference of 0.040%).
| Demographics | Rating | Rank | Average Family Size |
| Immigrants | Senegal | 57.5 /100 | #166 | Average 3.23 |
| Dutch West Indians | 56.9 /100 | #167 | Average 3.23 |
| Taiwanese | 54.2 /100 | #168 | Average 3.23 |
| Aleuts | 54.1 /100 | #169 | Average 3.23 |
| Arabs | 53.8 /100 | #170 | Average 3.23 |
| Chileans | 53.2 /100 | #171 | Average 3.23 |
| Immigrants | Congo | 52.7 /100 | #172 | Average 3.23 |
| Immigrants | Uruguay | 52.0 /100 | #173 | Average 3.23 |
| Immigrants | South Central Asia | 50.0 /100 | #174 | Average 3.23 |
| Immigrants | China | 49.9 /100 | #175 | Average 3.23 |
| Israelis | 48.7 /100 | #176 | Average 3.23 |
| Argentineans | 47.4 /100 | #177 | Average 3.23 |
| Spaniards | 47.2 /100 | #178 | Average 3.23 |
| Immigrants | Korea | 46.9 /100 | #179 | Average 3.23 |
| Palestinians | 46.6 /100 | #180 | Average 3.23 |
Demographics Similar to Comanche by Average Family Size
In terms of average family size, the demographic groups most similar to Comanche are Immigrants from Middle Africa (3.25, a difference of 0.010%), Cuban (3.25, a difference of 0.030%), Immigrants from Ethiopia (3.25, a difference of 0.040%), Subsaharan African (3.25, a difference of 0.040%), and Venezuelan (3.25, a difference of 0.040%).
| Demographics | Rating | Rank | Average Family Size |
| Immigrants | Hong Kong | 88.6 /100 | #129 | Excellent 3.26 |
| Laotians | 88.5 /100 | #130 | Excellent 3.26 |
| Immigrants | Western Asia | 87.7 /100 | #131 | Excellent 3.26 |
| Costa Ricans | 86.8 /100 | #132 | Excellent 3.26 |
| Immigrants | Venezuela | 86.3 /100 | #133 | Excellent 3.26 |
| Africans | 84.9 /100 | #134 | Excellent 3.25 |
| Panamanians | 84.2 /100 | #135 | Excellent 3.25 |
| Comanche | 82.8 /100 | #136 | Excellent 3.25 |
| Immigrants | Middle Africa | 82.4 /100 | #137 | Excellent 3.25 |
| Cubans | 81.8 /100 | #138 | Excellent 3.25 |
| Immigrants | Ethiopia | 81.6 /100 | #139 | Excellent 3.25 |
| Sub-Saharan Africans | 81.6 /100 | #140 | Excellent 3.25 |
| Venezuelans | 81.4 /100 | #141 | Excellent 3.25 |
| Liberians | 81.2 /100 | #142 | Excellent 3.25 |
| Bhutanese | 81.0 /100 | #143 | Excellent 3.25 |