Immigrants from Kuwait vs Comanche Married-Couple Family Poverty
COMPARE
Immigrants from Kuwait
Comanche
Married-Couple Family Poverty
Married-Couple Family Poverty Comparison
Immigrants from Kuwait
Comanche
5.0%
MARRIED-COUPLE FAMILY POVERTY
76.3/ 100
METRIC RATING
153rd/ 347
METRIC RANK
6.0%
MARRIED-COUPLE FAMILY POVERTY
0.7/ 100
METRIC RATING
255th/ 347
METRIC RANK
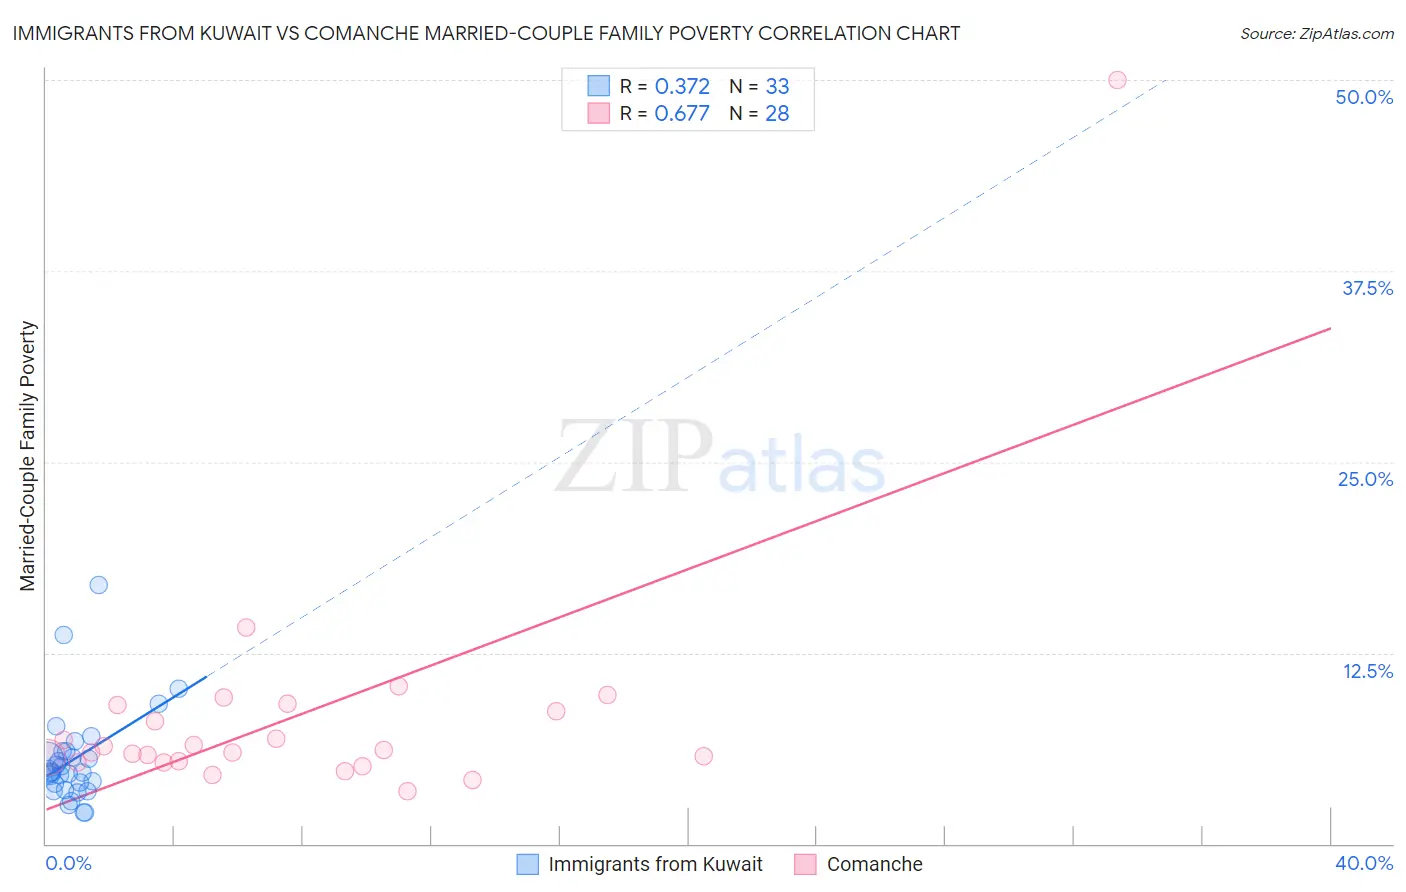
Immigrants from Kuwait vs Comanche Married-Couple Family Poverty Correlation Chart
The statistical analysis conducted on geographies consisting of 136,568,646 people shows a mild positive correlation between the proportion of Immigrants from Kuwait and poverty level among married-couple families in the United States with a correlation coefficient (R) of 0.372 and weighted average of 5.0%. Similarly, the statistical analysis conducted on geographies consisting of 109,532,955 people shows a significant positive correlation between the proportion of Comanche and poverty level among married-couple families in the United States with a correlation coefficient (R) of 0.677 and weighted average of 6.0%, a difference of 18.6%.
Married-Couple Family Poverty Correlation Summary
| Measurement | Immigrants from Kuwait | Comanche |
| Minimum | 2.0% | 3.4% |
| Maximum | 16.9% | 50.0% |
| Range | 14.9% | 46.6% |
| Mean | 5.6% | 8.4% |
| Median | 4.7% | 6.0% |
| Interquartile 25% (IQ1) | 3.8% | 5.4% |
| Interquartile 75% (IQ3) | 6.1% | 8.9% |
| Interquartile Range (IQR) | 2.3% | 3.5% |
| Standard Deviation (Sample) | 3.1% | 8.5% |
| Standard Deviation (Population) | 3.1% | 8.3% |
Similar Demographics by Married-Couple Family Poverty
Demographics Similar to Immigrants from Kuwait by Married-Couple Family Poverty
In terms of married-couple family poverty, the demographic groups most similar to Immigrants from Kuwait are Albanian (5.0%, a difference of 0.15%), Immigrants from Cameroon (5.0%, a difference of 0.16%), Brazilian (5.0%, a difference of 0.33%), Immigrants from Oceania (5.0%, a difference of 0.38%), and Syrian (5.0%, a difference of 0.41%).
| Demographics | Rating | Rank | Married-Couple Family Poverty |
| Mongolians | 79.8 /100 | #146 | Good 5.0% |
| Syrians | 78.7 /100 | #147 | Good 5.0% |
| Immigrants | Russia | 78.7 /100 | #148 | Good 5.0% |
| Immigrants | Oceania | 78.6 /100 | #149 | Good 5.0% |
| Brazilians | 78.3 /100 | #150 | Good 5.0% |
| Immigrants | Cameroon | 77.3 /100 | #151 | Good 5.0% |
| Albanians | 77.2 /100 | #152 | Good 5.0% |
| Immigrants | Kuwait | 76.3 /100 | #153 | Good 5.0% |
| Delaware | 73.7 /100 | #154 | Good 5.1% |
| Immigrants | Ethiopia | 72.4 /100 | #155 | Good 5.1% |
| Sri Lankans | 72.2 /100 | #156 | Good 5.1% |
| Argentineans | 70.7 /100 | #157 | Good 5.1% |
| Immigrants | South Eastern Asia | 70.4 /100 | #158 | Good 5.1% |
| Immigrants | Saudi Arabia | 70.3 /100 | #159 | Good 5.1% |
| Pennsylvania Germans | 68.5 /100 | #160 | Good 5.1% |
Demographics Similar to Comanche by Married-Couple Family Poverty
In terms of married-couple family poverty, the demographic groups most similar to Comanche are Immigrants from Somalia (6.0%, a difference of 0.15%), African (6.0%, a difference of 0.21%), Immigrants from Western Asia (6.0%, a difference of 0.30%), Bangladeshi (6.0%, a difference of 0.50%), and Immigrants from Burma/Myanmar (6.0%, a difference of 0.74%).
| Demographics | Rating | Rank | Married-Couple Family Poverty |
| Cree | 1.2 /100 | #248 | Tragic 5.9% |
| Tsimshian | 1.1 /100 | #249 | Tragic 5.9% |
| Immigrants | Eritrea | 1.1 /100 | #250 | Tragic 5.9% |
| Immigrants | Ghana | 1.0 /100 | #251 | Tragic 5.9% |
| Immigrants | Western Asia | 0.7 /100 | #252 | Tragic 6.0% |
| Africans | 0.7 /100 | #253 | Tragic 6.0% |
| Immigrants | Somalia | 0.7 /100 | #254 | Tragic 6.0% |
| Comanche | 0.7 /100 | #255 | Tragic 6.0% |
| Bangladeshis | 0.5 /100 | #256 | Tragic 6.0% |
| Immigrants | Burma/Myanmar | 0.5 /100 | #257 | Tragic 6.0% |
| Immigrants | Immigrants | 0.5 /100 | #258 | Tragic 6.0% |
| Alaskan Athabascans | 0.4 /100 | #259 | Tragic 6.1% |
| Jamaicans | 0.3 /100 | #260 | Tragic 6.1% |
| Senegalese | 0.3 /100 | #261 | Tragic 6.1% |
| Shoshone | 0.3 /100 | #262 | Tragic 6.1% |