Immigrants from Belize vs Comanche Married-Couple Family Poverty
COMPARE
Immigrants from Belize
Comanche
Married-Couple Family Poverty
Married-Couple Family Poverty Comparison
Immigrants from Belize
Comanche
6.7%
MARRIED-COUPLE FAMILY POVERTY
0.0/ 100
METRIC RATING
300th/ 347
METRIC RANK
6.0%
MARRIED-COUPLE FAMILY POVERTY
0.7/ 100
METRIC RATING
255th/ 347
METRIC RANK
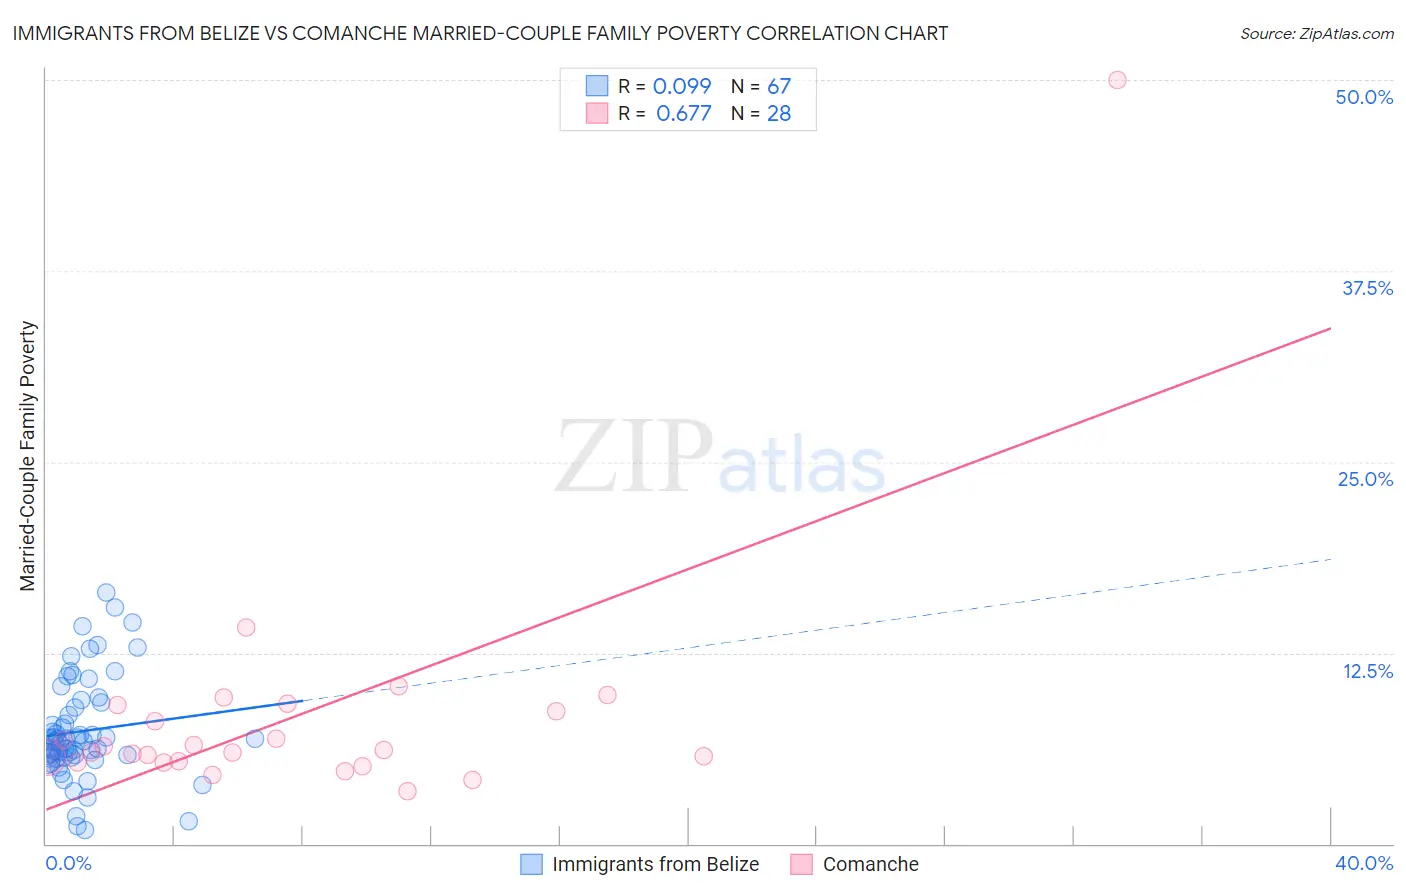
Immigrants from Belize vs Comanche Married-Couple Family Poverty Correlation Chart
The statistical analysis conducted on geographies consisting of 130,147,118 people shows a slight positive correlation between the proportion of Immigrants from Belize and poverty level among married-couple families in the United States with a correlation coefficient (R) of 0.099 and weighted average of 6.7%. Similarly, the statistical analysis conducted on geographies consisting of 109,532,955 people shows a significant positive correlation between the proportion of Comanche and poverty level among married-couple families in the United States with a correlation coefficient (R) of 0.677 and weighted average of 6.0%, a difference of 12.1%.
Married-Couple Family Poverty Correlation Summary
| Measurement | Immigrants from Belize | Comanche |
| Minimum | 0.90% | 3.4% |
| Maximum | 16.5% | 50.0% |
| Range | 15.6% | 46.6% |
| Mean | 7.4% | 8.4% |
| Median | 6.7% | 6.0% |
| Interquartile 25% (IQ1) | 5.6% | 5.4% |
| Interquartile 75% (IQ3) | 9.2% | 8.9% |
| Interquartile Range (IQR) | 3.6% | 3.5% |
| Standard Deviation (Sample) | 3.3% | 8.5% |
| Standard Deviation (Population) | 3.3% | 8.3% |
Similar Demographics by Married-Couple Family Poverty
Demographics Similar to Immigrants from Belize by Married-Couple Family Poverty
In terms of married-couple family poverty, the demographic groups most similar to Immigrants from Belize are Nicaraguan (6.7%, a difference of 0.15%), Central American (6.7%, a difference of 0.60%), Immigrants from Guyana (6.7%, a difference of 0.69%), Immigrants from Ecuador (6.7%, a difference of 0.74%), and Kiowa (6.6%, a difference of 0.76%).
| Demographics | Rating | Rank | Married-Couple Family Poverty |
| Arapaho | 0.0 /100 | #293 | Tragic 6.6% |
| Bahamians | 0.0 /100 | #294 | Tragic 6.6% |
| Immigrants | Uzbekistan | 0.0 /100 | #295 | Tragic 6.6% |
| U.S. Virgin Islanders | 0.0 /100 | #296 | Tragic 6.6% |
| Kiowa | 0.0 /100 | #297 | Tragic 6.6% |
| Immigrants | Guyana | 0.0 /100 | #298 | Tragic 6.7% |
| Nicaraguans | 0.0 /100 | #299 | Tragic 6.7% |
| Immigrants | Belize | 0.0 /100 | #300 | Tragic 6.7% |
| Central Americans | 0.0 /100 | #301 | Tragic 6.7% |
| Immigrants | Ecuador | 0.0 /100 | #302 | Tragic 6.7% |
| Immigrants | El Salvador | 0.0 /100 | #303 | Tragic 6.8% |
| Cubans | 0.0 /100 | #304 | Tragic 6.8% |
| Haitians | 0.0 /100 | #305 | Tragic 6.8% |
| Immigrants | Haiti | 0.0 /100 | #306 | Tragic 7.0% |
| Guatemalans | 0.0 /100 | #307 | Tragic 7.0% |
Demographics Similar to Comanche by Married-Couple Family Poverty
In terms of married-couple family poverty, the demographic groups most similar to Comanche are Immigrants from Somalia (6.0%, a difference of 0.15%), African (6.0%, a difference of 0.21%), Immigrants from Western Asia (6.0%, a difference of 0.30%), Bangladeshi (6.0%, a difference of 0.50%), and Immigrants from Burma/Myanmar (6.0%, a difference of 0.74%).
| Demographics | Rating | Rank | Married-Couple Family Poverty |
| Cree | 1.2 /100 | #248 | Tragic 5.9% |
| Tsimshian | 1.1 /100 | #249 | Tragic 5.9% |
| Immigrants | Eritrea | 1.1 /100 | #250 | Tragic 5.9% |
| Immigrants | Ghana | 1.0 /100 | #251 | Tragic 5.9% |
| Immigrants | Western Asia | 0.7 /100 | #252 | Tragic 6.0% |
| Africans | 0.7 /100 | #253 | Tragic 6.0% |
| Immigrants | Somalia | 0.7 /100 | #254 | Tragic 6.0% |
| Comanche | 0.7 /100 | #255 | Tragic 6.0% |
| Bangladeshis | 0.5 /100 | #256 | Tragic 6.0% |
| Immigrants | Burma/Myanmar | 0.5 /100 | #257 | Tragic 6.0% |
| Immigrants | Immigrants | 0.5 /100 | #258 | Tragic 6.0% |
| Alaskan Athabascans | 0.4 /100 | #259 | Tragic 6.1% |
| Jamaicans | 0.3 /100 | #260 | Tragic 6.1% |
| Senegalese | 0.3 /100 | #261 | Tragic 6.1% |
| Shoshone | 0.3 /100 | #262 | Tragic 6.1% |