Guamanian/Chamorro vs Comanche Married-Couple Family Poverty

COMPARE

Guamanian/Chamorro
Race
Ancestry
AfghanAfricanAlaska NativeAlaskan AthabascanAlbanianAleutAlsatianAmericanApacheArabArapahoArgentineanArmenianAssyrian/Chaldean/SyriacAustralianAustrianBahamianBangladeshiBarbadianBasqueBelgianBelizeanBermudanBhutaneseBlackfeetBolivianBrazilianBritishBritish West IndianBulgarianBurmeseCajunCambodianCanadianCape VerdeanCarpatho RusynCelticCentral AmericanCentral American IndianCherokeeCheyenneChickasawChileanChineseChippewaChoctawColombianColvilleCosta RicanCreeCreekCroatianCrowCubanCypriotCzechCzechoslovakianDanishDelawareDominicanDutchDutch West IndianEastern EuropeanEcuadorianEgyptianEnglishEstonianEthiopianEuropeanFijianFilipinoFinnishFrenchFrench American IndianFrench CanadianGermanGerman RussianGhanaianGreekGuamanian/ChamorroGuatemalanGuyaneseHaitianHmongHonduranHopiHoumaHungarianIcelanderIndian (Asian)IndonesianInupiatIranianIraqiIrishIroquoisIsraeliItalianJamaicanJapaneseJordanianKenyanKiowaKoreanLaotianLatvianLebaneseLiberianLithuanianLumbeeLuxembourgerMacedonianMalaysianMalteseMarshalleseMenomineeMexicanMexican American IndianMongolianMoroccanNative HawaiianNavajoNepaleseNew ZealanderNicaraguanNigerianNorthern EuropeanNorwegianOkinawanOsageOttawaPaiutePakistaniPalestinianPanamanianParaguayanPennsylvania GermanPeruvianPimaPolishPortuguesePotawatomiPuebloPuerto RicanPuget Sound SalishRomanianRussianSalvadoranSamoanScandinavianScotch-IrishScottishSeminoleSenegaleseSerbianShoshoneSierra LeoneanSiouxSlavicSlovakSloveneSomaliSouth AfricanSouth AmericanSouth American IndianSoviet UnionSpaniardSpanishSpanish AmericanSpanish American IndianSri LankanSubsaharan AfricanSudaneseSwedishSwissSyrianTaiwaneseThaiTlingit-HaidaTohono O'OdhamTonganTrinidadian and TobagonianTsimshianTurkishU.S. Virgin IslanderUgandanUkrainianUruguayanUteVenezuelanVietnameseWelshWest IndianYakamaYaquiYugoslavianYumanYup'ikZimbabwean
Immigration
NonimmigrantsImmigrantsAfghanistanAfricaAlbaniaArgentinaArmeniaAsiaAustraliaAustriaBahamasBangladeshBarbadosBelarusBelgiumBelizeBoliviaBosnia and HerzegovinaBrazilBulgariaBurma/MyanmarCabo VerdeCambodiaCameroonCanadaCaribbeanCentral AmericaChileChinaColombiaCongoCosta RicaCroatiaCubaCzechoslovakiaDenmarkDominicaDominican RepublicEastern AfricaEastern AsiaEastern EuropeEcuadorEgyptEl SalvadorEnglandEritreaEthiopiaEuropeFijiFranceGermanyGhanaGreeceGrenadaGuatemalaGuyanaHaitiHondurasHong KongHungaryIndiaIndonesiaIranIraqIrelandIsraelItalyJamaicaJapanJordanKazakhstanKenyaKoreaKuwaitLaosLatin AmericaLatviaLebanonLiberiaLithuaniaMalaysiaMexicoMicronesiaMiddle AfricaMoldovaMoroccoNepalNetherlandsNicaraguaNigeriaNorth AmericaNorth MacedoniaNorthern AfricaNorthern EuropeNorwayOceaniaPakistanPanamaPeruPhilippinesPolandPortugalRomaniaRussiaSaudi ArabiaScotlandSenegalSerbiaSierra LeoneSingaporeSomaliaSouth AfricaSouth AmericaSouth Central AsiaSouth Eastern AsiaSouthern EuropeSpainSri LankaSt. Vincent and the GrenadinesSudanSwedenSwitzerlandSyriaTaiwanThailandTrinidad and TobagoTurkeyUgandaUkraineUruguayUzbekistanVenezuelaVietnamWest IndiesWestern AfricaWestern AsiaWestern EuropeYemenZaireZimbabweAzores
Comanche
Race
Ancestry
AfghanAfricanAlaska NativeAlaskan AthabascanAlbanianAleutAlsatianAmericanApacheArabArapahoArgentineanArmenianAssyrian/Chaldean/SyriacAustralianAustrianBahamianBangladeshiBarbadianBasqueBelgianBelizeanBermudanBhutaneseBlackfeetBolivianBrazilianBritishBritish West IndianBulgarianBurmeseCajunCambodianCanadianCape VerdeanCarpatho RusynCelticCentral AmericanCentral American IndianCherokeeCheyenneChickasawChileanChineseChippewaChoctawColombianColvilleComancheCosta RicanCreeCreekCroatianCrowCubanCypriotCzechCzechoslovakianDanishDelawareDominicanDutchDutch West IndianEastern EuropeanEcuadorianEgyptianEnglishEstonianEthiopianEuropeanFijianFilipinoFinnishFrenchFrench American IndianFrench CanadianGermanGerman RussianGhanaianGreekGuatemalanGuyaneseHaitianHmongHonduranHopiHoumaHungarianIcelanderIndian (Asian)IndonesianInupiatIranianIraqiIrishIroquoisIsraeliItalianJamaicanJapaneseJordanianKenyanKiowaKoreanLaotianLatvianLebaneseLiberianLithuanianLumbeeLuxembourgerMacedonianMalaysianMalteseMarshalleseMenomineeMexicanMexican American IndianMongolianMoroccanNative HawaiianNavajoNepaleseNew ZealanderNicaraguanNigerianNorthern EuropeanNorwegianOkinawanOsageOttawaPaiutePakistaniPalestinianPanamanianParaguayanPennsylvania GermanPeruvianPimaPolishPortuguesePotawatomiPuebloPuerto RicanPuget Sound SalishRomanianRussianSalvadoranSamoanScandinavianScotch-IrishScottishSeminoleSenegaleseSerbianShoshoneSierra LeoneanSiouxSlavicSlovakSloveneSomaliSouth AfricanSouth AmericanSouth American IndianSoviet UnionSpaniardSpanishSpanish AmericanSpanish American IndianSri LankanSubsaharan AfricanSudaneseSwedishSwissSyrianTaiwaneseThaiTlingit-HaidaTohono O'OdhamTonganTrinidadian and TobagonianTsimshianTurkishU.S. Virgin IslanderUgandanUkrainianUruguayanUteVenezuelanVietnameseWelshWest IndianYakamaYaquiYugoslavianYumanYup'ikZimbabwean
Immigration
NonimmigrantsImmigrantsAfghanistanAfricaAlbaniaArgentinaArmeniaAsiaAustraliaAustriaBahamasBangladeshBarbadosBelarusBelgiumBelizeBoliviaBosnia and HerzegovinaBrazilBulgariaBurma/MyanmarCabo VerdeCambodiaCameroonCanadaCaribbeanCentral AmericaChileChinaColombiaCongoCosta RicaCroatiaCubaCzechoslovakiaDenmarkDominicaDominican RepublicEastern AfricaEastern AsiaEastern EuropeEcuadorEgyptEl SalvadorEnglandEritreaEthiopiaEuropeFijiFranceGermanyGhanaGreeceGrenadaGuatemalaGuyanaHaitiHondurasHong KongHungaryIndiaIndonesiaIranIraqIrelandIsraelItalyJamaicaJapanJordanKazakhstanKenyaKoreaKuwaitLaosLatin AmericaLatviaLebanonLiberiaLithuaniaMalaysiaMexicoMicronesiaMiddle AfricaMoldovaMoroccoNepalNetherlandsNicaraguaNigeriaNorth AmericaNorth MacedoniaNorthern AfricaNorthern EuropeNorwayOceaniaPakistanPanamaPeruPhilippinesPolandPortugalRomaniaRussiaSaudi ArabiaScotlandSenegalSerbiaSierra LeoneSingaporeSomaliaSouth AfricaSouth AmericaSouth Central AsiaSouth Eastern AsiaSouthern EuropeSpainSri LankaSt. Vincent and the GrenadinesSudanSwedenSwitzerlandSyriaTaiwanThailandTrinidad and TobagoTurkeyUgandaUkraineUruguayUzbekistanVenezuelaVietnamWest IndiesWestern AfricaWestern AsiaWestern EuropeYemenZaireZimbabweAzores
Married-Couple Family Poverty
Income
Poverty
Unemployment
Labor Participation
Family Structure
Vehicle Availability
Education Level
Disability

Married-Couple Family Poverty Comparison

Guamanians/Chamorros

Comanche

Excellent
Tragic
4.9%
MARRIED-COUPLE FAMILY POVERTY
86.5/ 100
METRIC RATING
137th/ 347
METRIC RANK
6.0%
MARRIED-COUPLE FAMILY POVERTY
0.7/ 100
METRIC RATING
255th/ 347
METRIC RANK

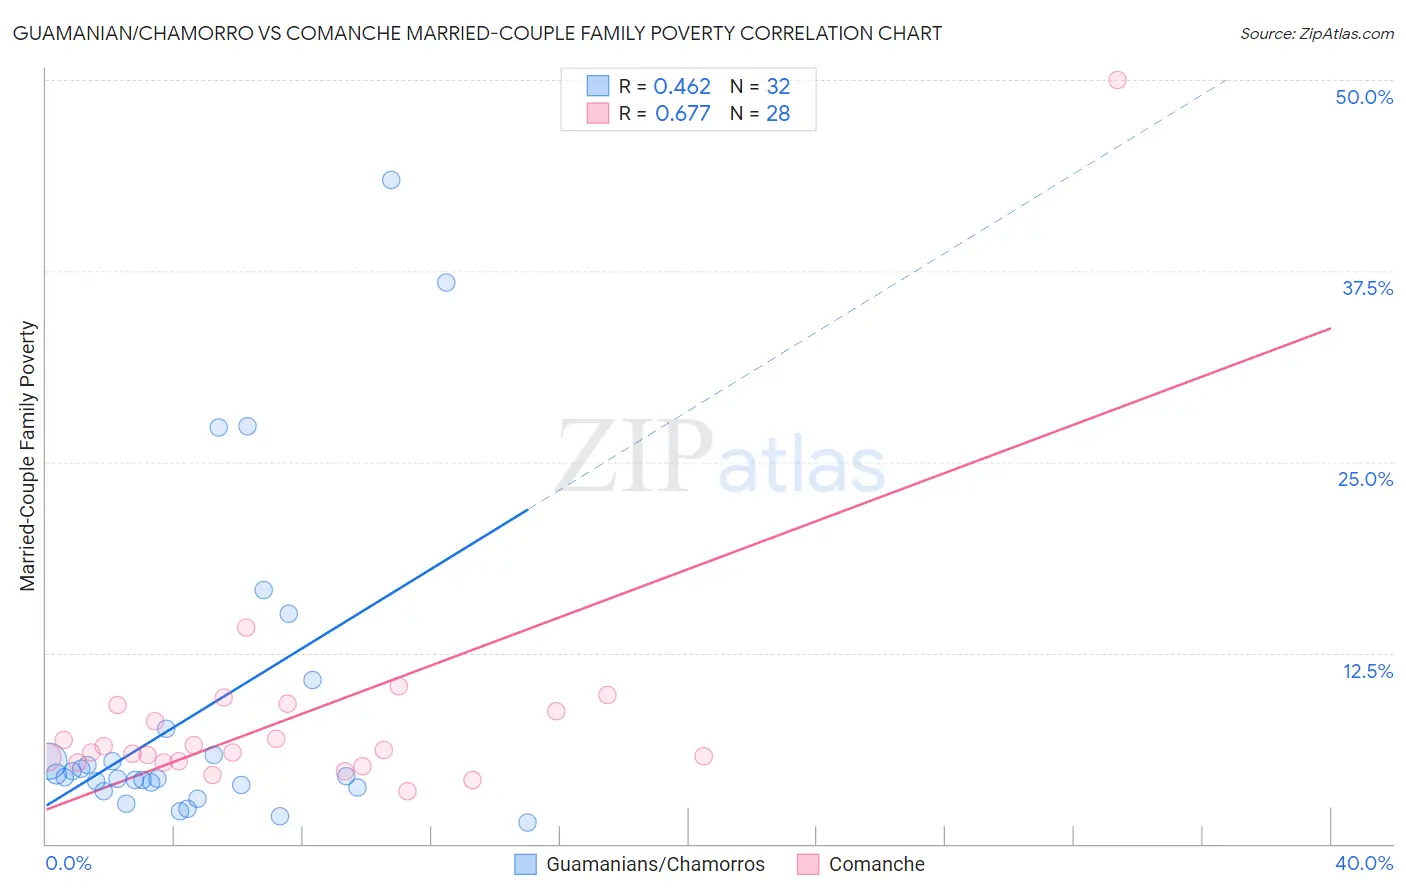
Guamanian/Chamorro vs Comanche Married-Couple Family Poverty Correlation Chart

The statistical analysis conducted on geographies consisting of 221,186,731 people shows a moderate positive correlation between the proportion of Guamanians/Chamorros and poverty level among married-couple families in the United States with a correlation coefficient (R) of 0.462 and weighted average of 4.9%. Similarly, the statistical analysis conducted on geographies consisting of 109,532,955 people shows a significant positive correlation between the proportion of Comanche and poverty level among married-couple families in the United States with a correlation coefficient (R) of 0.677 and weighted average of 6.0%, a difference of 21.1%.
Guamanian/Chamorro vs Comanche Married-Couple Family Poverty

Married-Couple Family Poverty Correlation Summary

MeasurementGuamanian/ChamorroComanche
Minimum1.4%3.4%
Maximum43.5%50.0%
Range42.0%46.6%
Mean8.7%8.4%
Median4.4%6.0%
Interquartile 25% (IQ1)3.8%5.4%
Interquartile 75% (IQ3)6.7%8.9%
Interquartile Range (IQR)2.9%3.5%
Standard Deviation (Sample)10.4%8.5%
Standard Deviation (Population)10.3%8.3%

Similar Demographics by Married-Couple Family Poverty

Demographics Similar to Guamanians/Chamorros by Married-Couple Family Poverty

In terms of married-couple family poverty, the demographic groups most similar to Guamanians/Chamorros are Chilean (4.9%, a difference of 0.13%), German Russian (5.0%, a difference of 0.36%), Immigrants from Portugal (5.0%, a difference of 0.42%), Immigrants from Brazil (5.0%, a difference of 0.47%), and Immigrants from China (5.0%, a difference of 0.47%).
DemographicsRating | RankMarried-Couple Family Poverty
Soviet Union
90.7
/100
|
#130
Exceptional
4.9%
Immigrants | Eastern Europe
90.5
/100
|
#131
Exceptional
4.9%
Puget Sound Salish
90.4
/100
|
#132
Exceptional
4.9%
Immigrants | Kenya
90.2
/100
|
#133
Exceptional
4.9%
Samoans
90.2
/100
|
#134
Exceptional
4.9%
Assyrians/Chaldeans/Syriacs
89.4
/100
|
#135
Excellent
4.9%
Immigrants | Hungary
88.7
/100
|
#136
Excellent
4.9%
Guamanians/Chamorros
86.5
/100
|
#137
Excellent
4.9%
Chileans
86.0
/100
|
#138
Excellent
4.9%
German Russians
85.1
/100
|
#139
Excellent
5.0%
Immigrants | Portugal
84.8
/100
|
#140
Excellent
5.0%
Immigrants | Brazil
84.6
/100
|
#141
Excellent
5.0%
Immigrants | China
84.6
/100
|
#142
Excellent
5.0%
Immigrants | Egypt
83.4
/100
|
#143
Excellent
5.0%
Hmong
83.2
/100
|
#144
Excellent
5.0%

Demographics Similar to Comanche by Married-Couple Family Poverty

In terms of married-couple family poverty, the demographic groups most similar to Comanche are Immigrants from Somalia (6.0%, a difference of 0.15%), African (6.0%, a difference of 0.21%), Immigrants from Western Asia (6.0%, a difference of 0.30%), Bangladeshi (6.0%, a difference of 0.50%), and Immigrants from Burma/Myanmar (6.0%, a difference of 0.74%).
DemographicsRating | RankMarried-Couple Family Poverty
Cree
1.2
/100
|
#248
Tragic
5.9%
Tsimshian
1.1
/100
|
#249
Tragic
5.9%
Immigrants | Eritrea
1.1
/100
|
#250
Tragic
5.9%
Immigrants | Ghana
1.0
/100
|
#251
Tragic
5.9%
Immigrants | Western Asia
0.7
/100
|
#252
Tragic
6.0%
Africans
0.7
/100
|
#253
Tragic
6.0%
Immigrants | Somalia
0.7
/100
|
#254
Tragic
6.0%
Comanche
0.7
/100
|
#255
Tragic
6.0%
Bangladeshis
0.5
/100
|
#256
Tragic
6.0%
Immigrants | Burma/Myanmar
0.5
/100
|
#257
Tragic
6.0%
Immigrants | Immigrants
0.5
/100
|
#258
Tragic
6.0%
Alaskan Athabascans
0.4
/100
|
#259
Tragic
6.1%
Jamaicans
0.3
/100
|
#260
Tragic
6.1%
Senegalese
0.3
/100
|
#261
Tragic
6.1%
Shoshone
0.3
/100
|
#262
Tragic
6.1%