Immigrants from South America vs Dutch Doctorate Degree
COMPARE
Immigrants from South America
Dutch
Doctorate Degree
Doctorate Degree Comparison
Immigrants from South America
Dutch
1.8%
DOCTORATE DEGREE
23.3/ 100
METRIC RATING
199th/ 347
METRIC RANK
1.8%
DOCTORATE DEGREE
27.4/ 100
METRIC RATING
192nd/ 347
METRIC RANK
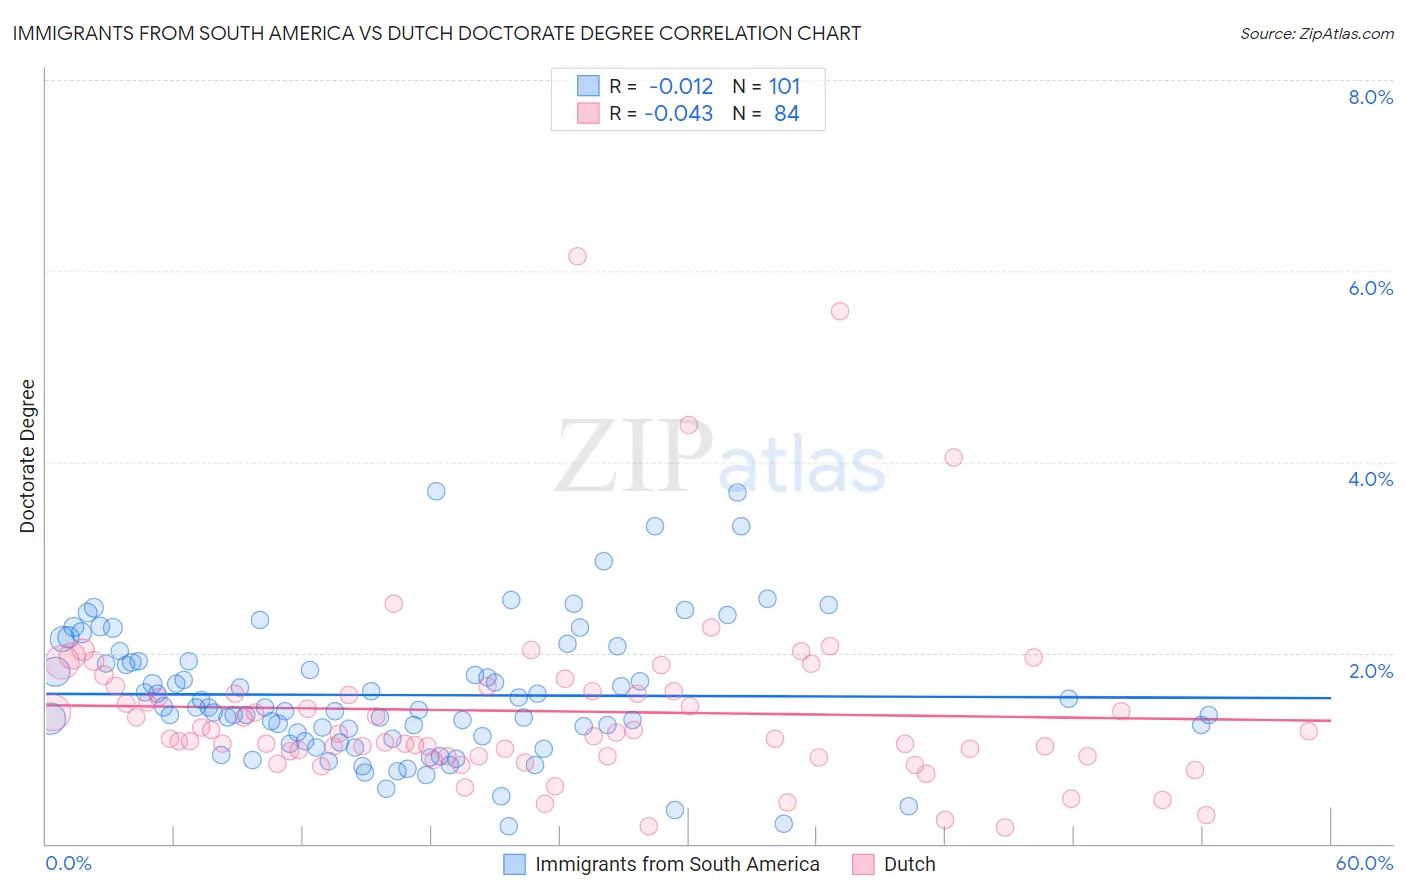
Immigrants from South America vs Dutch Doctorate Degree Correlation Chart
The statistical analysis conducted on geographies consisting of 479,287,152 people shows no correlation between the proportion of Immigrants from South America and percentage of population with at least doctorate degree education in the United States with a correlation coefficient (R) of -0.012 and weighted average of 1.8%. Similarly, the statistical analysis conducted on geographies consisting of 532,685,178 people shows no correlation between the proportion of Dutch and percentage of population with at least doctorate degree education in the United States with a correlation coefficient (R) of -0.043 and weighted average of 1.8%, a difference of 0.84%.
Doctorate Degree Correlation Summary
| Measurement | Immigrants from South America | Dutch |
| Minimum | 0.18% | 0.18% |
| Maximum | 3.7% | 6.2% |
| Range | 3.5% | 6.0% |
| Mean | 1.6% | 1.4% |
| Median | 1.4% | 1.1% |
| Interquartile 25% (IQ1) | 1.1% | 0.91% |
| Interquartile 75% (IQ3) | 1.9% | 1.6% |
| Interquartile Range (IQR) | 0.82% | 0.68% |
| Standard Deviation (Sample) | 0.70% | 0.98% |
| Standard Deviation (Population) | 0.70% | 0.97% |
Demographics Similar to Immigrants from South America and Dutch by Doctorate Degree
In terms of doctorate degree, the demographic groups most similar to Immigrants from South America are White/Caucasian (1.8%, a difference of 0.11%), Immigrants from Nigeria (1.8%, a difference of 0.18%), Immigrants from Ghana (1.8%, a difference of 0.29%), Chinese (1.8%, a difference of 0.37%), and Subsaharan African (1.8%, a difference of 0.38%). Similarly, the demographic groups most similar to Dutch are German Russian (1.8%, a difference of 0.070%), Uruguayan (1.8%, a difference of 0.24%), South American (1.8%, a difference of 0.39%), Immigrants from Somalia (1.8%, a difference of 0.39%), and Subsaharan African (1.8%, a difference of 0.46%).
| Demographics | Rating | Rank | Doctorate Degree |
| Slovaks | 36.4 /100 | #185 | Fair 1.8% |
| Peruvians | 34.4 /100 | #186 | Fair 1.8% |
| Czechoslovakians | 33.0 /100 | #187 | Fair 1.8% |
| Germans | 30.5 /100 | #188 | Fair 1.8% |
| French Canadians | 30.2 /100 | #189 | Fair 1.8% |
| Immigrants | Costa Rica | 30.2 /100 | #190 | Fair 1.8% |
| South Americans | 29.5 /100 | #191 | Fair 1.8% |
| Dutch | 27.4 /100 | #192 | Fair 1.8% |
| German Russians | 27.1 /100 | #193 | Fair 1.8% |
| Uruguayans | 26.2 /100 | #194 | Fair 1.8% |
| Immigrants | Somalia | 25.4 /100 | #195 | Fair 1.8% |
| Sub-Saharan Africans | 25.1 /100 | #196 | Fair 1.8% |
| Chinese | 25.1 /100 | #197 | Fair 1.8% |
| Immigrants | Ghana | 24.6 /100 | #198 | Fair 1.8% |
| Immigrants | South America | 23.3 /100 | #199 | Fair 1.8% |
| Whites/Caucasians | 22.8 /100 | #200 | Fair 1.8% |
| Immigrants | Nigeria | 22.4 /100 | #201 | Fair 1.8% |
| Portuguese | 21.4 /100 | #202 | Fair 1.8% |
| Immigrants | Vietnam | 21.4 /100 | #203 | Fair 1.8% |
| Somalis | 21.2 /100 | #204 | Fair 1.7% |
| Venezuelans | 19.5 /100 | #205 | Poor 1.7% |