Immigrants from South America vs Dutch Child Poverty Under the Age of 16
COMPARE
Immigrants from South America
Dutch
Child Poverty Under the Age of 16
Child Poverty Under the Age of 16 Comparison
Immigrants from South America
Dutch
16.4%
CHILD POVERTY UNDER THE AGE OF 16
40.8/ 100
METRIC RATING
181st/ 347
METRIC RANK
14.8%
CHILD POVERTY UNDER THE AGE OF 16
95.1/ 100
METRIC RATING
100th/ 347
METRIC RANK
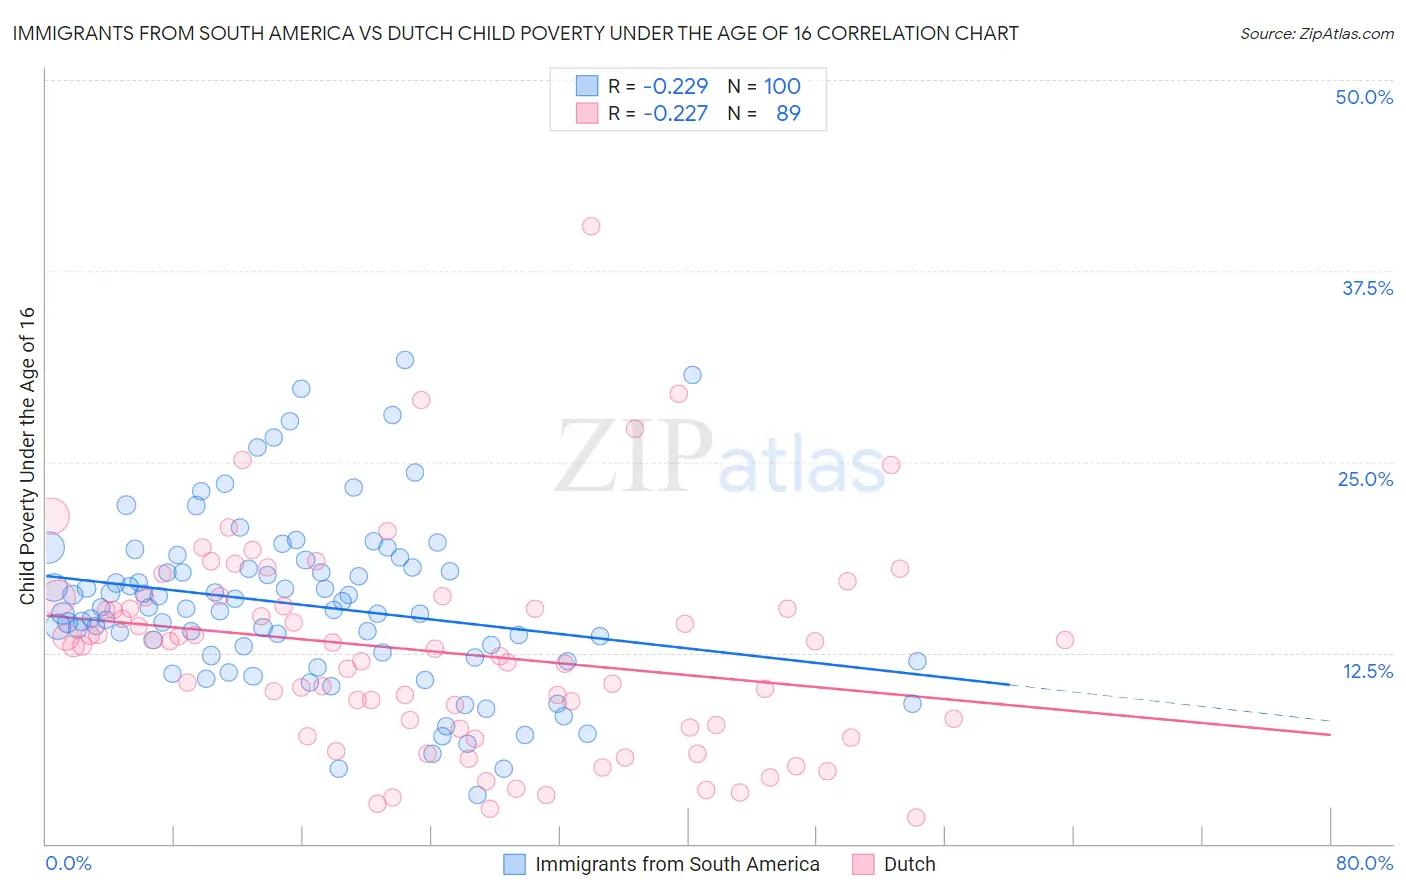
Immigrants from South America vs Dutch Child Poverty Under the Age of 16 Correlation Chart
The statistical analysis conducted on geographies consisting of 479,730,201 people shows a weak negative correlation between the proportion of Immigrants from South America and poverty level among children under the age of 16 in the United States with a correlation coefficient (R) of -0.229 and weighted average of 16.4%. Similarly, the statistical analysis conducted on geographies consisting of 542,951,177 people shows a weak negative correlation between the proportion of Dutch and poverty level among children under the age of 16 in the United States with a correlation coefficient (R) of -0.227 and weighted average of 14.8%, a difference of 11.0%.
Child Poverty Under the Age of 16 Correlation Summary
| Measurement | Immigrants from South America | Dutch |
| Minimum | 3.2% | 1.7% |
| Maximum | 31.7% | 40.4% |
| Range | 28.5% | 38.7% |
| Mean | 15.6% | 12.6% |
| Median | 15.3% | 13.0% |
| Interquartile 25% (IQ1) | 12.2% | 7.6% |
| Interquartile 75% (IQ3) | 18.1% | 15.9% |
| Interquartile Range (IQR) | 5.8% | 8.3% |
| Standard Deviation (Sample) | 5.6% | 6.8% |
| Standard Deviation (Population) | 5.6% | 6.8% |
Similar Demographics by Child Poverty Under the Age of 16
Demographics Similar to Immigrants from South America by Child Poverty Under the Age of 16
In terms of child poverty under the age of 16, the demographic groups most similar to Immigrants from South America are South American Indian (16.4%, a difference of 0.12%), Immigrants from Ethiopia (16.4%, a difference of 0.18%), Immigrants from Syria (16.4%, a difference of 0.18%), Ethiopian (16.3%, a difference of 0.31%), and Hawaiian (16.4%, a difference of 0.32%).
| Demographics | Rating | Rank | Child Poverty Under the Age of 16 |
| Whites/Caucasians | 50.0 /100 | #174 | Average 16.2% |
| Scotch-Irish | 47.1 /100 | #175 | Average 16.3% |
| Lebanese | 45.9 /100 | #176 | Average 16.3% |
| Ethiopians | 43.4 /100 | #177 | Average 16.3% |
| Immigrants | Ethiopia | 42.3 /100 | #178 | Average 16.4% |
| Immigrants | Syria | 42.3 /100 | #179 | Average 16.4% |
| South American Indians | 41.8 /100 | #180 | Average 16.4% |
| Immigrants | South America | 40.8 /100 | #181 | Average 16.4% |
| Hawaiians | 38.2 /100 | #182 | Fair 16.4% |
| Celtics | 38.2 /100 | #183 | Fair 16.4% |
| Immigrants | Western Asia | 38.0 /100 | #184 | Fair 16.4% |
| Immigrants | Bosnia and Herzegovina | 37.4 /100 | #185 | Fair 16.5% |
| Kenyans | 34.1 /100 | #186 | Fair 16.5% |
| Arabs | 31.4 /100 | #187 | Fair 16.6% |
| Immigrants | Morocco | 31.2 /100 | #188 | Fair 16.6% |
Demographics Similar to Dutch by Child Poverty Under the Age of 16
In terms of child poverty under the age of 16, the demographic groups most similar to Dutch are Immigrants from Switzerland (14.8%, a difference of 0.010%), Romanian (14.8%, a difference of 0.080%), Immigrants from Egypt (14.8%, a difference of 0.13%), Immigrants from England (14.8%, a difference of 0.17%), and Basque (14.8%, a difference of 0.28%).
| Demographics | Rating | Rank | Child Poverty Under the Age of 16 |
| Argentineans | 96.6 /100 | #93 | Exceptional 14.6% |
| Immigrants | South Africa | 96.3 /100 | #94 | Exceptional 14.6% |
| Immigrants | Croatia | 96.1 /100 | #95 | Exceptional 14.6% |
| Immigrants | France | 95.8 /100 | #96 | Exceptional 14.7% |
| Paraguayans | 95.7 /100 | #97 | Exceptional 14.7% |
| Immigrants | Belarus | 95.7 /100 | #98 | Exceptional 14.7% |
| British | 95.5 /100 | #99 | Exceptional 14.7% |
| Dutch | 95.1 /100 | #100 | Exceptional 14.8% |
| Immigrants | Switzerland | 95.1 /100 | #101 | Exceptional 14.8% |
| Romanians | 95.0 /100 | #102 | Exceptional 14.8% |
| Immigrants | Egypt | 94.9 /100 | #103 | Exceptional 14.8% |
| Immigrants | England | 94.8 /100 | #104 | Exceptional 14.8% |
| Basques | 94.7 /100 | #105 | Exceptional 14.8% |
| Serbians | 94.5 /100 | #106 | Exceptional 14.8% |
| Chileans | 94.4 /100 | #107 | Exceptional 14.8% |