Cape Verdean vs Hawaiian Married-Couple Family Poverty
COMPARE
Cape Verdean
Hawaiian
Married-Couple Family Poverty
Married-Couple Family Poverty Comparison
Cape Verdeans
Hawaiians
5.3%
MARRIED-COUPLE FAMILY POVERTY
30.7/ 100
METRIC RATING
192nd/ 347
METRIC RANK
5.1%
MARRIED-COUPLE FAMILY POVERTY
62.3/ 100
METRIC RATING
164th/ 347
METRIC RANK
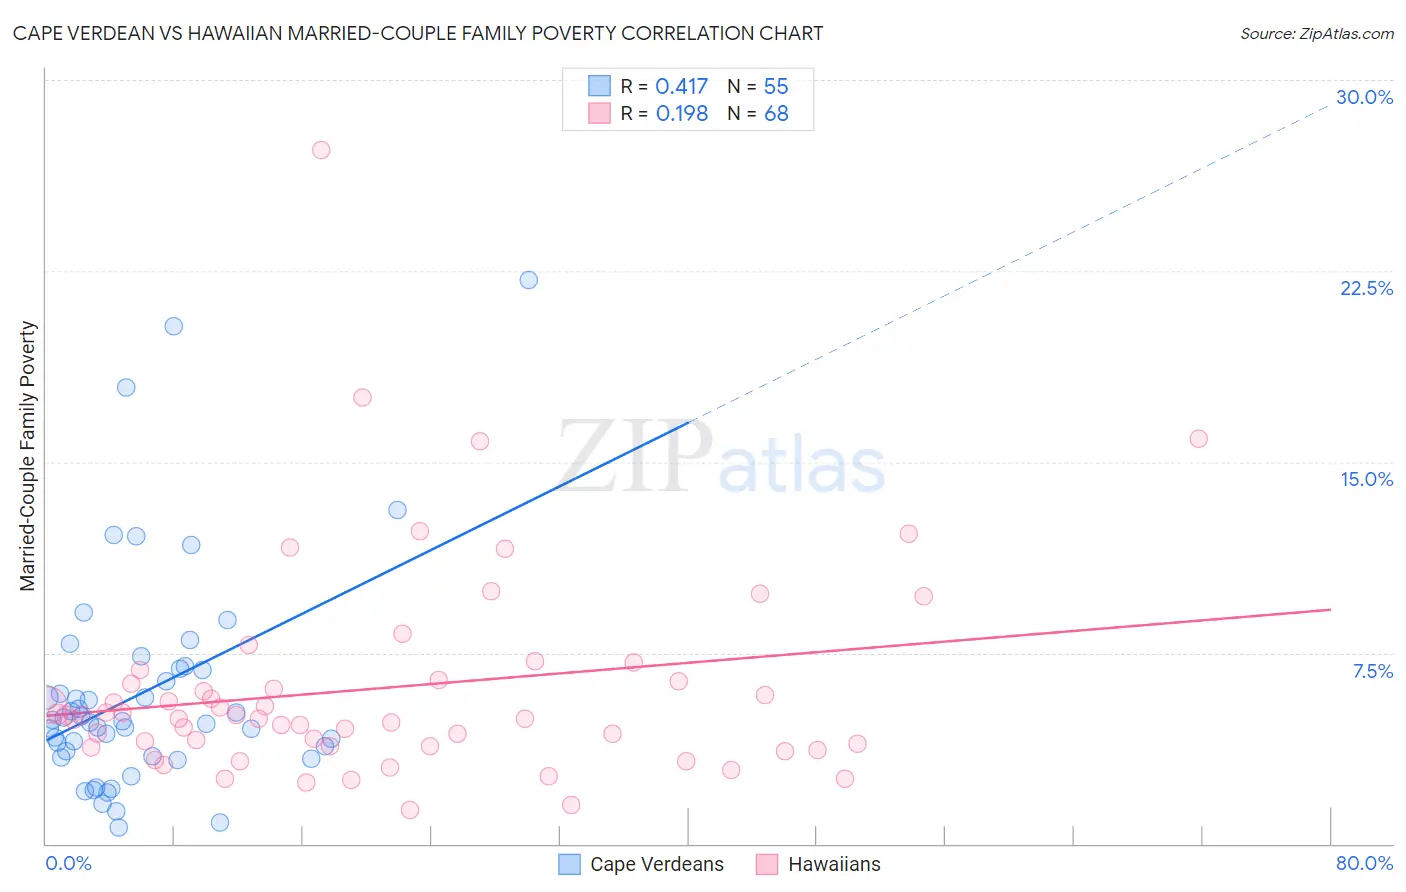
Cape Verdean vs Hawaiian Married-Couple Family Poverty Correlation Chart
The statistical analysis conducted on geographies consisting of 107,147,993 people shows a moderate positive correlation between the proportion of Cape Verdeans and poverty level among married-couple families in the United States with a correlation coefficient (R) of 0.417 and weighted average of 5.3%. Similarly, the statistical analysis conducted on geographies consisting of 325,605,449 people shows a poor positive correlation between the proportion of Hawaiians and poverty level among married-couple families in the United States with a correlation coefficient (R) of 0.198 and weighted average of 5.1%, a difference of 3.9%.
Married-Couple Family Poverty Correlation Summary
| Measurement | Cape Verdean | Hawaiian |
| Minimum | 0.66% | 1.3% |
| Maximum | 22.2% | 27.3% |
| Range | 21.5% | 26.0% |
| Mean | 6.0% | 6.1% |
| Median | 4.8% | 5.0% |
| Interquartile 25% (IQ1) | 3.4% | 3.8% |
| Interquartile 75% (IQ3) | 6.9% | 6.4% |
| Interquartile Range (IQR) | 3.4% | 2.6% |
| Standard Deviation (Sample) | 4.4% | 4.2% |
| Standard Deviation (Population) | 4.4% | 4.2% |
Similar Demographics by Married-Couple Family Poverty
Demographics Similar to Cape Verdeans by Married-Couple Family Poverty
In terms of married-couple family poverty, the demographic groups most similar to Cape Verdeans are Immigrants from Cabo Verde (5.3%, a difference of 0.030%), Ugandan (5.3%, a difference of 0.12%), Malaysian (5.4%, a difference of 0.17%), South American Indian (5.3%, a difference of 0.23%), and Israeli (5.3%, a difference of 0.32%).
| Demographics | Rating | Rank | Married-Couple Family Poverty |
| Americans | 35.4 /100 | #185 | Fair 5.3% |
| Hungarians | 34.7 /100 | #186 | Fair 5.3% |
| Immigrants | Albania | 33.8 /100 | #187 | Fair 5.3% |
| Israelis | 33.1 /100 | #188 | Fair 5.3% |
| South American Indians | 32.5 /100 | #189 | Fair 5.3% |
| Ugandans | 31.6 /100 | #190 | Fair 5.3% |
| Immigrants | Cabo Verde | 30.9 /100 | #191 | Fair 5.3% |
| Cape Verdeans | 30.7 /100 | #192 | Fair 5.3% |
| Malaysians | 29.5 /100 | #193 | Fair 5.4% |
| Immigrants | Israel | 27.8 /100 | #194 | Fair 5.4% |
| Immigrants | Azores | 27.5 /100 | #195 | Fair 5.4% |
| Spaniards | 27.4 /100 | #196 | Fair 5.4% |
| Liberians | 26.3 /100 | #197 | Fair 5.4% |
| Immigrants | Belarus | 26.2 /100 | #198 | Fair 5.4% |
| Uruguayans | 25.0 /100 | #199 | Fair 5.4% |
Demographics Similar to Hawaiians by Married-Couple Family Poverty
In terms of married-couple family poverty, the demographic groups most similar to Hawaiians are Immigrants from Malaysia (5.1%, a difference of 0.010%), Paraguayan (5.1%, a difference of 0.10%), Costa Rican (5.1%, a difference of 0.10%), Sierra Leonean (5.1%, a difference of 0.24%), and Immigrants from Jordan (5.1%, a difference of 0.55%).
| Demographics | Rating | Rank | Married-Couple Family Poverty |
| Argentineans | 70.7 /100 | #157 | Good 5.1% |
| Immigrants | South Eastern Asia | 70.4 /100 | #158 | Good 5.1% |
| Immigrants | Saudi Arabia | 70.3 /100 | #159 | Good 5.1% |
| Pennsylvania Germans | 68.5 /100 | #160 | Good 5.1% |
| Ethiopians | 68.1 /100 | #161 | Good 5.1% |
| Immigrants | Jordan | 66.5 /100 | #162 | Good 5.1% |
| Sierra Leoneans | 64.1 /100 | #163 | Good 5.1% |
| Hawaiians | 62.3 /100 | #164 | Good 5.1% |
| Immigrants | Malaysia | 62.2 /100 | #165 | Good 5.1% |
| Paraguayans | 61.5 /100 | #166 | Good 5.1% |
| Costa Ricans | 61.5 /100 | #167 | Good 5.1% |
| Immigrants | Uganda | 54.9 /100 | #168 | Average 5.2% |
| Ottawa | 54.5 /100 | #169 | Average 5.2% |
| Immigrants | Argentina | 54.4 /100 | #170 | Average 5.2% |
| Bermudans | 52.9 /100 | #171 | Average 5.2% |