Immigrants from North America vs Blackfeet Married-Couple Family Poverty
COMPARE
Immigrants from North America
Blackfeet
Married-Couple Family Poverty
Married-Couple Family Poverty Comparison
Immigrants from North America
Blackfeet
4.5%
MARRIED-COUPLE FAMILY POVERTY
99.3/ 100
METRIC RATING
71st/ 347
METRIC RANK
6.2%
MARRIED-COUPLE FAMILY POVERTY
0.2/ 100
METRIC RATING
265th/ 347
METRIC RANK
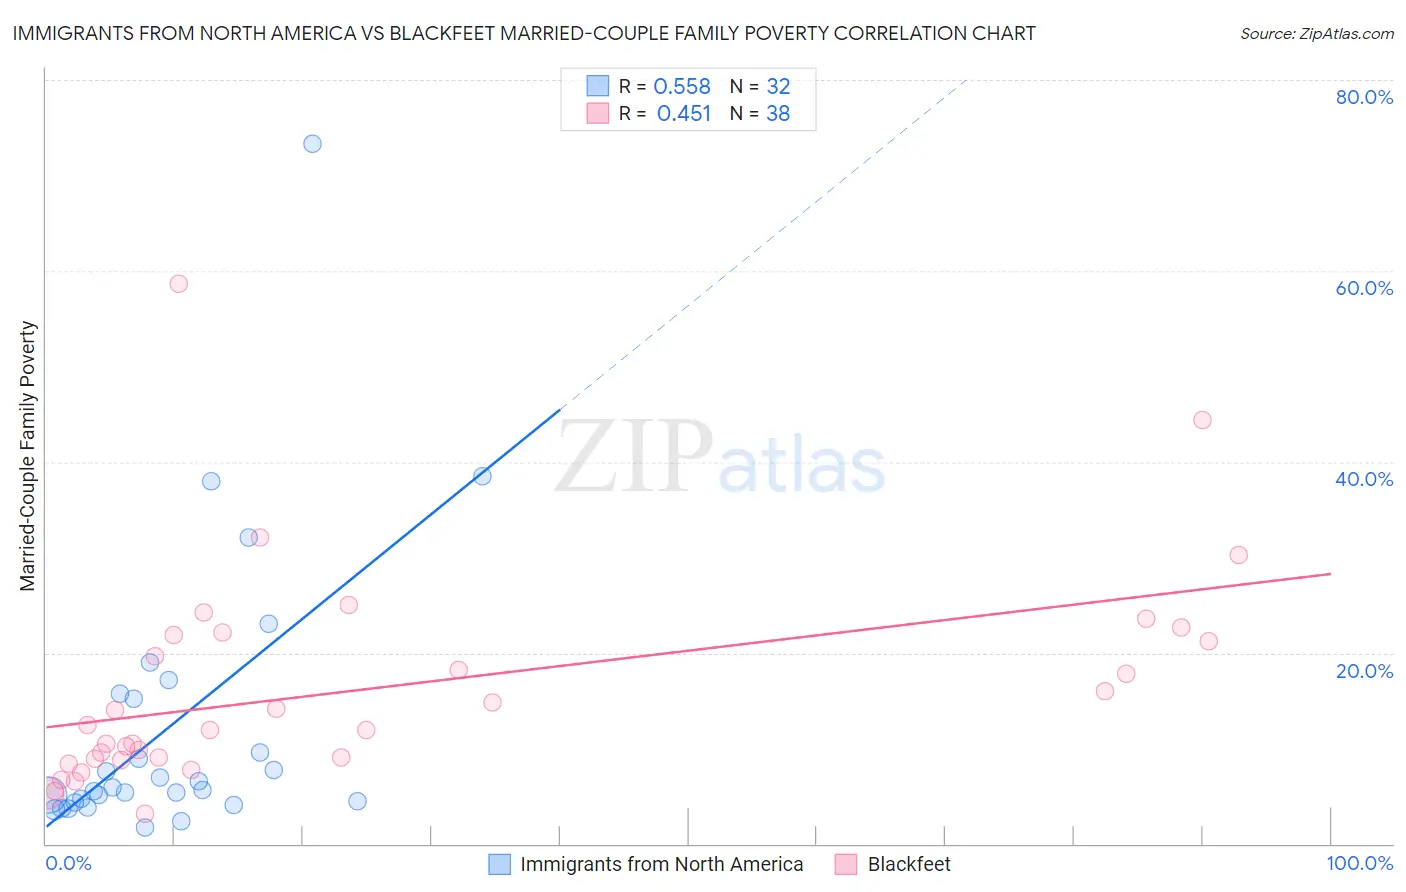
Immigrants from North America vs Blackfeet Married-Couple Family Poverty Correlation Chart
The statistical analysis conducted on geographies consisting of 456,163,835 people shows a substantial positive correlation between the proportion of Immigrants from North America and poverty level among married-couple families in the United States with a correlation coefficient (R) of 0.558 and weighted average of 4.5%. Similarly, the statistical analysis conducted on geographies consisting of 307,833,949 people shows a moderate positive correlation between the proportion of Blackfeet and poverty level among married-couple families in the United States with a correlation coefficient (R) of 0.451 and weighted average of 6.2%, a difference of 37.9%.
Married-Couple Family Poverty Correlation Summary
| Measurement | Immigrants from North America | Blackfeet |
| Minimum | 1.7% | 3.1% |
| Maximum | 73.3% | 58.6% |
| Range | 71.6% | 55.5% |
| Mean | 12.3% | 16.2% |
| Median | 5.7% | 12.2% |
| Interquartile 25% (IQ1) | 4.4% | 9.0% |
| Interquartile 75% (IQ3) | 15.5% | 21.8% |
| Interquartile Range (IQR) | 11.0% | 12.8% |
| Standard Deviation (Sample) | 14.9% | 11.2% |
| Standard Deviation (Population) | 14.7% | 11.1% |
Similar Demographics by Married-Couple Family Poverty
Demographics Similar to Immigrants from North America by Married-Couple Family Poverty
In terms of married-couple family poverty, the demographic groups most similar to Immigrants from North America are Immigrants from England (4.5%, a difference of 0.090%), Ukrainian (4.5%, a difference of 0.22%), Immigrants from Austria (4.5%, a difference of 0.32%), Immigrants from Korea (4.5%, a difference of 0.42%), and New Zealander (4.4%, a difference of 0.55%).
| Demographics | Rating | Rank | Married-Couple Family Poverty |
| Immigrants | Bulgaria | 99.5 /100 | #64 | Exceptional 4.4% |
| Macedonians | 99.4 /100 | #65 | Exceptional 4.4% |
| Immigrants | Serbia | 99.4 /100 | #66 | Exceptional 4.4% |
| Immigrants | Canada | 99.4 /100 | #67 | Exceptional 4.4% |
| Slavs | 99.4 /100 | #68 | Exceptional 4.4% |
| New Zealanders | 99.4 /100 | #69 | Exceptional 4.4% |
| Immigrants | Korea | 99.4 /100 | #70 | Exceptional 4.5% |
| Immigrants | North America | 99.3 /100 | #71 | Exceptional 4.5% |
| Immigrants | England | 99.3 /100 | #72 | Exceptional 4.5% |
| Ukrainians | 99.2 /100 | #73 | Exceptional 4.5% |
| Immigrants | Austria | 99.2 /100 | #74 | Exceptional 4.5% |
| Cambodians | 99.2 /100 | #75 | Exceptional 4.5% |
| Immigrants | South Africa | 99.1 /100 | #76 | Exceptional 4.5% |
| Immigrants | Latvia | 99.1 /100 | #77 | Exceptional 4.5% |
| Scotch-Irish | 99.1 /100 | #78 | Exceptional 4.5% |
Demographics Similar to Blackfeet by Married-Couple Family Poverty
In terms of married-couple family poverty, the demographic groups most similar to Blackfeet are Creek (6.2%, a difference of 0.080%), Spanish American (6.2%, a difference of 0.13%), Immigrants from Congo (6.1%, a difference of 0.43%), Alaska Native (6.2%, a difference of 0.61%), and Immigrants from Senegal (6.1%, a difference of 0.66%).
| Demographics | Rating | Rank | Married-Couple Family Poverty |
| Immigrants | Immigrants | 0.5 /100 | #258 | Tragic 6.0% |
| Alaskan Athabascans | 0.4 /100 | #259 | Tragic 6.1% |
| Jamaicans | 0.3 /100 | #260 | Tragic 6.1% |
| Senegalese | 0.3 /100 | #261 | Tragic 6.1% |
| Shoshone | 0.3 /100 | #262 | Tragic 6.1% |
| Immigrants | Senegal | 0.3 /100 | #263 | Tragic 6.1% |
| Immigrants | Congo | 0.2 /100 | #264 | Tragic 6.1% |
| Blackfeet | 0.2 /100 | #265 | Tragic 6.2% |
| Creek | 0.2 /100 | #266 | Tragic 6.2% |
| Spanish Americans | 0.2 /100 | #267 | Tragic 6.2% |
| Alaska Natives | 0.2 /100 | #268 | Tragic 6.2% |
| Immigrants | West Indies | 0.1 /100 | #269 | Tragic 6.2% |
| Immigrants | Jamaica | 0.1 /100 | #270 | Tragic 6.2% |
| Immigrants | Bahamas | 0.1 /100 | #271 | Tragic 6.2% |
| Trinidadians and Tobagonians | 0.1 /100 | #272 | Tragic 6.2% |