Immigrants from North America vs Potawatomi Married-Couple Family Poverty
COMPARE
Immigrants from North America
Potawatomi
Married-Couple Family Poverty
Married-Couple Family Poverty Comparison
Immigrants from North America
Potawatomi
4.5%
MARRIED-COUPLE FAMILY POVERTY
99.3/ 100
METRIC RATING
71st/ 347
METRIC RANK
5.5%
MARRIED-COUPLE FAMILY POVERTY
12.4/ 100
METRIC RATING
216th/ 347
METRIC RANK
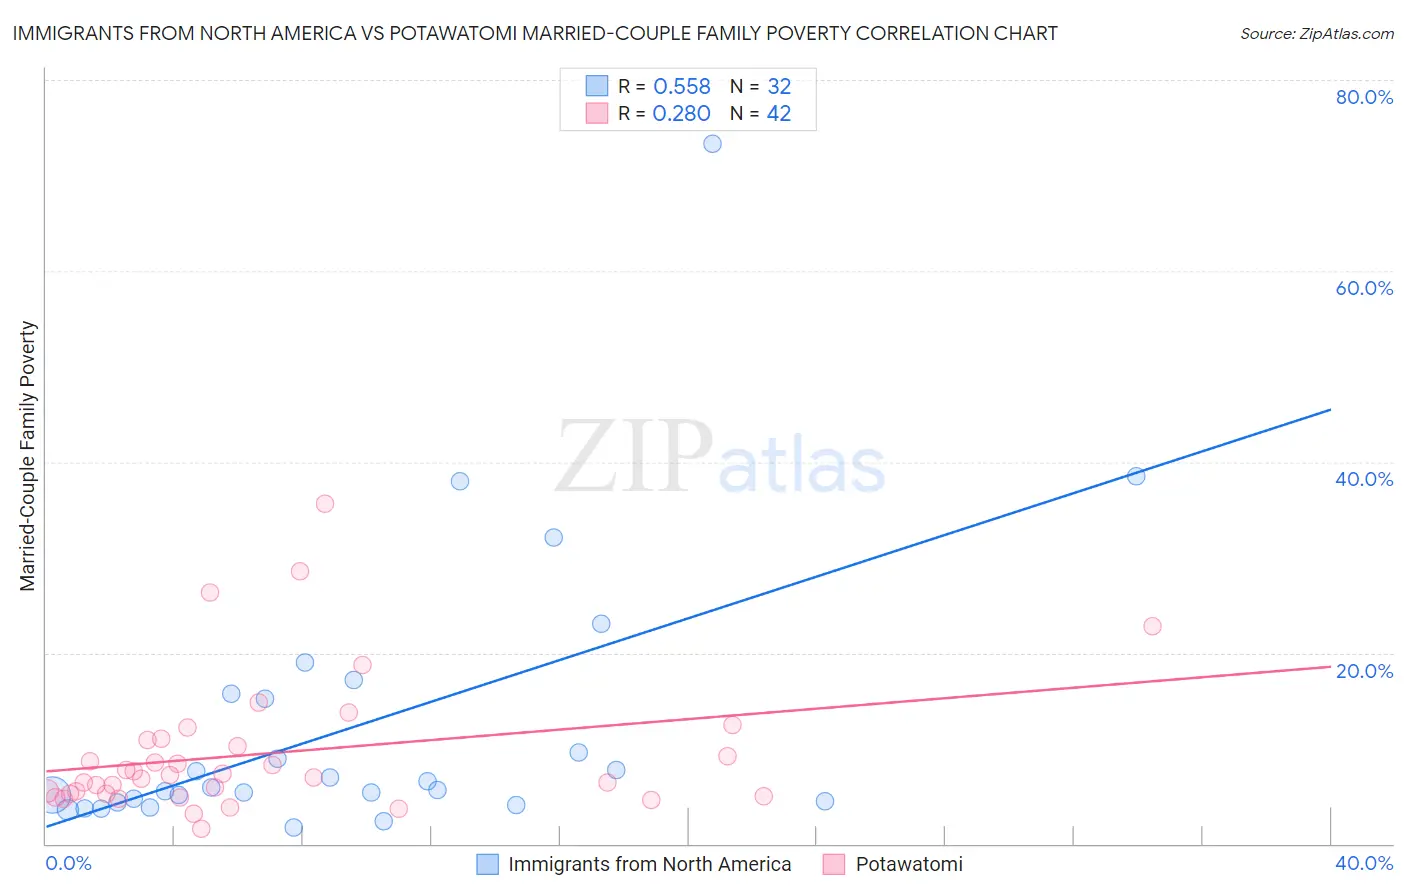
Immigrants from North America vs Potawatomi Married-Couple Family Poverty Correlation Chart
The statistical analysis conducted on geographies consisting of 456,163,835 people shows a substantial positive correlation between the proportion of Immigrants from North America and poverty level among married-couple families in the United States with a correlation coefficient (R) of 0.558 and weighted average of 4.5%. Similarly, the statistical analysis conducted on geographies consisting of 117,481,648 people shows a weak positive correlation between the proportion of Potawatomi and poverty level among married-couple families in the United States with a correlation coefficient (R) of 0.280 and weighted average of 5.5%, a difference of 23.4%.
Married-Couple Family Poverty Correlation Summary
| Measurement | Immigrants from North America | Potawatomi |
| Minimum | 1.7% | 1.6% |
| Maximum | 73.3% | 35.6% |
| Range | 71.6% | 34.0% |
| Mean | 12.3% | 9.5% |
| Median | 5.7% | 7.1% |
| Interquartile 25% (IQ1) | 4.4% | 5.2% |
| Interquartile 75% (IQ3) | 15.5% | 10.9% |
| Interquartile Range (IQR) | 11.0% | 5.7% |
| Standard Deviation (Sample) | 14.9% | 7.2% |
| Standard Deviation (Population) | 14.7% | 7.1% |
Similar Demographics by Married-Couple Family Poverty
Demographics Similar to Immigrants from North America by Married-Couple Family Poverty
In terms of married-couple family poverty, the demographic groups most similar to Immigrants from North America are Immigrants from England (4.5%, a difference of 0.090%), Ukrainian (4.5%, a difference of 0.22%), Immigrants from Austria (4.5%, a difference of 0.32%), Immigrants from Korea (4.5%, a difference of 0.42%), and New Zealander (4.4%, a difference of 0.55%).
| Demographics | Rating | Rank | Married-Couple Family Poverty |
| Immigrants | Bulgaria | 99.5 /100 | #64 | Exceptional 4.4% |
| Macedonians | 99.4 /100 | #65 | Exceptional 4.4% |
| Immigrants | Serbia | 99.4 /100 | #66 | Exceptional 4.4% |
| Immigrants | Canada | 99.4 /100 | #67 | Exceptional 4.4% |
| Slavs | 99.4 /100 | #68 | Exceptional 4.4% |
| New Zealanders | 99.4 /100 | #69 | Exceptional 4.4% |
| Immigrants | Korea | 99.4 /100 | #70 | Exceptional 4.5% |
| Immigrants | North America | 99.3 /100 | #71 | Exceptional 4.5% |
| Immigrants | England | 99.3 /100 | #72 | Exceptional 4.5% |
| Ukrainians | 99.2 /100 | #73 | Exceptional 4.5% |
| Immigrants | Austria | 99.2 /100 | #74 | Exceptional 4.5% |
| Cambodians | 99.2 /100 | #75 | Exceptional 4.5% |
| Immigrants | South Africa | 99.1 /100 | #76 | Exceptional 4.5% |
| Immigrants | Latvia | 99.1 /100 | #77 | Exceptional 4.5% |
| Scotch-Irish | 99.1 /100 | #78 | Exceptional 4.5% |
Demographics Similar to Potawatomi by Married-Couple Family Poverty
In terms of married-couple family poverty, the demographic groups most similar to Potawatomi are Armenian (5.5%, a difference of 0.12%), Iroquois (5.5%, a difference of 0.18%), Immigrants from Liberia (5.5%, a difference of 0.23%), Immigrants from Nigeria (5.5%, a difference of 0.29%), and Afghan (5.5%, a difference of 0.31%).
| Demographics | Rating | Rank | Married-Couple Family Poverty |
| Immigrants | Syria | 15.4 /100 | #209 | Poor 5.5% |
| Immigrants | Micronesia | 14.4 /100 | #210 | Poor 5.5% |
| Nigerians | 14.3 /100 | #211 | Poor 5.5% |
| Immigrants | Thailand | 14.0 /100 | #212 | Poor 5.5% |
| Immigrants | Liberia | 13.3 /100 | #213 | Poor 5.5% |
| Iroquois | 13.1 /100 | #214 | Poor 5.5% |
| Armenians | 12.8 /100 | #215 | Poor 5.5% |
| Potawatomi | 12.4 /100 | #216 | Poor 5.5% |
| Immigrants | Nigeria | 11.3 /100 | #217 | Poor 5.5% |
| Afghans | 11.2 /100 | #218 | Poor 5.5% |
| Japanese | 9.8 /100 | #219 | Tragic 5.6% |
| Colombians | 9.2 /100 | #220 | Tragic 5.6% |
| Panamanians | 9.2 /100 | #221 | Tragic 5.6% |
| Cajuns | 6.9 /100 | #222 | Tragic 5.6% |
| Immigrants | Fiji | 6.7 /100 | #223 | Tragic 5.6% |