Immigrants from Morocco vs Latvian Married-Couple Family Poverty
COMPARE
Immigrants from Morocco
Latvian
Married-Couple Family Poverty
Married-Couple Family Poverty Comparison
Immigrants from Morocco
Latvians
5.4%
MARRIED-COUPLE FAMILY POVERTY
24.3/ 100
METRIC RATING
200th/ 347
METRIC RANK
3.9%
MARRIED-COUPLE FAMILY POVERTY
100.0/ 100
METRIC RATING
7th/ 347
METRIC RANK
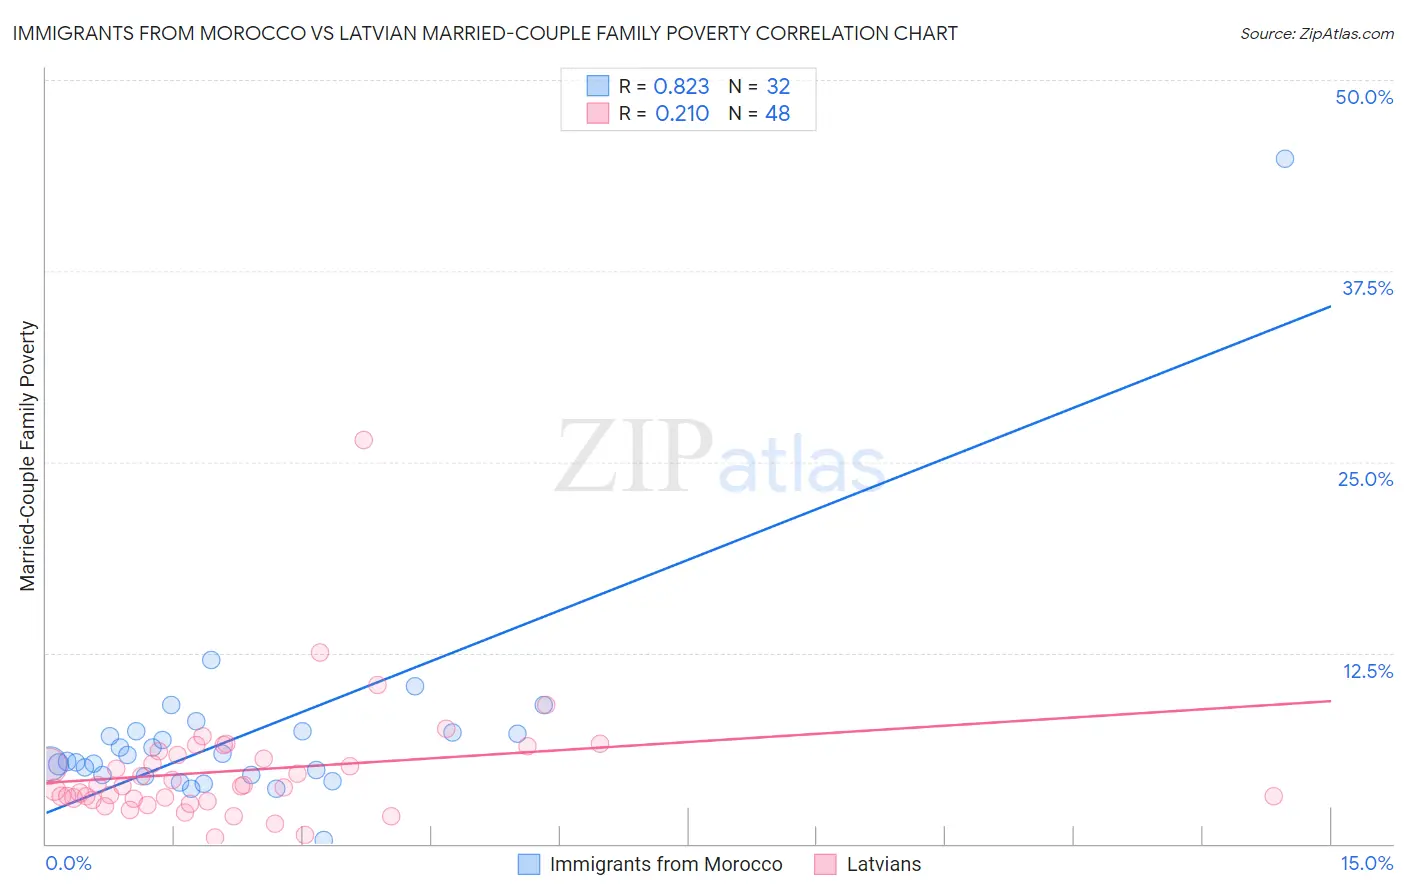
Immigrants from Morocco vs Latvian Married-Couple Family Poverty Correlation Chart
The statistical analysis conducted on geographies consisting of 178,420,133 people shows a very strong positive correlation between the proportion of Immigrants from Morocco and poverty level among married-couple families in the United States with a correlation coefficient (R) of 0.823 and weighted average of 5.4%. Similarly, the statistical analysis conducted on geographies consisting of 219,282,296 people shows a weak positive correlation between the proportion of Latvians and poverty level among married-couple families in the United States with a correlation coefficient (R) of 0.210 and weighted average of 3.9%, a difference of 38.3%.
Married-Couple Family Poverty Correlation Summary
| Measurement | Immigrants from Morocco | Latvian |
| Minimum | 0.27% | 0.39% |
| Maximum | 44.8% | 26.5% |
| Range | 44.6% | 26.1% |
| Mean | 7.2% | 4.8% |
| Median | 5.6% | 3.8% |
| Interquartile 25% (IQ1) | 4.5% | 2.9% |
| Interquartile 75% (IQ3) | 7.3% | 5.9% |
| Interquartile Range (IQR) | 2.8% | 3.0% |
| Standard Deviation (Sample) | 7.2% | 4.0% |
| Standard Deviation (Population) | 7.1% | 3.9% |
Similar Demographics by Married-Couple Family Poverty
Demographics Similar to Immigrants from Morocco by Married-Couple Family Poverty
In terms of married-couple family poverty, the demographic groups most similar to Immigrants from Morocco are Lebanese (5.4%, a difference of 0.020%), Immigrants from Middle Africa (5.4%, a difference of 0.080%), Uruguayan (5.4%, a difference of 0.11%), Immigrants from Belarus (5.4%, a difference of 0.29%), and Liberian (5.4%, a difference of 0.31%).
| Demographics | Rating | Rank | Married-Couple Family Poverty |
| Malaysians | 29.5 /100 | #193 | Fair 5.4% |
| Immigrants | Israel | 27.8 /100 | #194 | Fair 5.4% |
| Immigrants | Azores | 27.5 /100 | #195 | Fair 5.4% |
| Spaniards | 27.4 /100 | #196 | Fair 5.4% |
| Liberians | 26.3 /100 | #197 | Fair 5.4% |
| Immigrants | Belarus | 26.2 /100 | #198 | Fair 5.4% |
| Uruguayans | 25.0 /100 | #199 | Fair 5.4% |
| Immigrants | Morocco | 24.3 /100 | #200 | Fair 5.4% |
| Lebanese | 24.1 /100 | #201 | Fair 5.4% |
| Immigrants | Middle Africa | 23.8 /100 | #202 | Fair 5.4% |
| Immigrants | Peru | 21.8 /100 | #203 | Fair 5.4% |
| Immigrants | Costa Rica | 19.4 /100 | #204 | Poor 5.4% |
| Chippewa | 18.9 /100 | #205 | Poor 5.4% |
| Osage | 18.4 /100 | #206 | Poor 5.4% |
| Immigrants | Africa | 17.6 /100 | #207 | Poor 5.5% |
Demographics Similar to Latvians by Married-Couple Family Poverty
In terms of married-couple family poverty, the demographic groups most similar to Latvians are Luxembourger (3.9%, a difference of 0.52%), Thai (3.9%, a difference of 0.54%), Croatian (3.9%, a difference of 0.98%), Carpatho Rusyn (3.9%, a difference of 1.0%), and Swedish (3.9%, a difference of 1.1%).
| Demographics | Rating | Rank | Married-Couple Family Poverty |
| Immigrants | India | 100.0 /100 | #1 | Exceptional 3.6% |
| Chinese | 100.0 /100 | #2 | Exceptional 3.6% |
| Norwegians | 100.0 /100 | #3 | Exceptional 3.7% |
| Slovenes | 100.0 /100 | #4 | Exceptional 3.8% |
| Swedes | 100.0 /100 | #5 | Exceptional 3.9% |
| Luxembourgers | 100.0 /100 | #6 | Exceptional 3.9% |
| Latvians | 100.0 /100 | #7 | Exceptional 3.9% |
| Thais | 100.0 /100 | #8 | Exceptional 3.9% |
| Croatians | 100.0 /100 | #9 | Exceptional 3.9% |
| Carpatho Rusyns | 100.0 /100 | #10 | Exceptional 3.9% |
| Lithuanians | 100.0 /100 | #11 | Exceptional 4.0% |
| Bulgarians | 100.0 /100 | #12 | Exceptional 4.0% |
| Czechs | 100.0 /100 | #13 | Exceptional 4.0% |
| Slovaks | 100.0 /100 | #14 | Exceptional 4.0% |
| Poles | 100.0 /100 | #15 | Exceptional 4.0% |