Immigrants from Morocco vs Latvian 11th Grade
COMPARE
Immigrants from Morocco
Latvian
11th Grade
11th Grade Comparison
Immigrants from Morocco
Latvians
92.4%
11TH GRADE
38.6/ 100
METRIC RATING
182nd/ 347
METRIC RANK
94.7%
11TH GRADE
100.0/ 100
METRIC RATING
12th/ 347
METRIC RANK
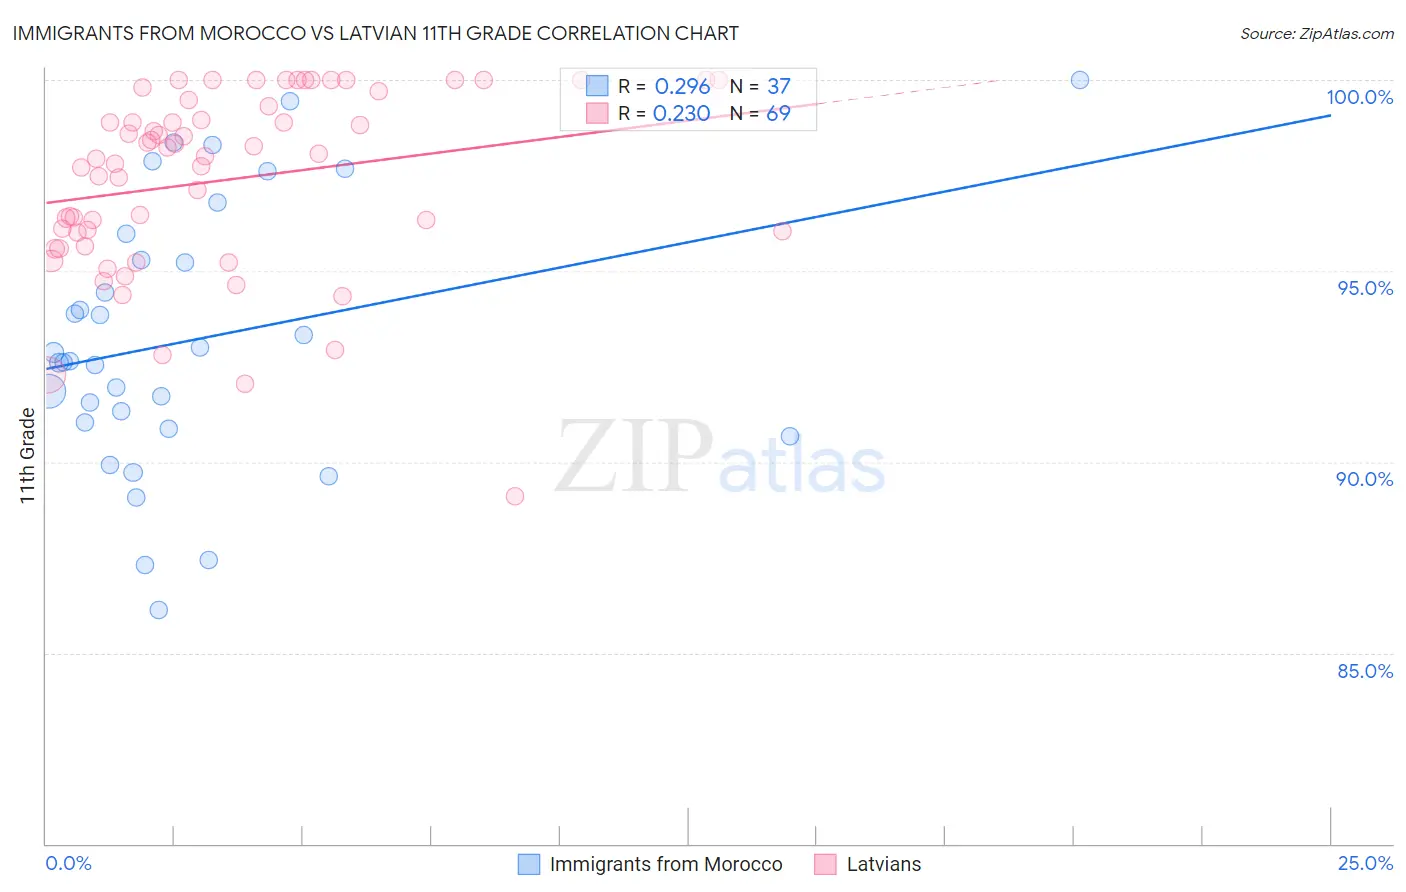
Immigrants from Morocco vs Latvian 11th Grade Correlation Chart
The statistical analysis conducted on geographies consisting of 178,912,438 people shows a weak positive correlation between the proportion of Immigrants from Morocco and percentage of population with at least 11th grade education in the United States with a correlation coefficient (R) of 0.296 and weighted average of 92.4%. Similarly, the statistical analysis conducted on geographies consisting of 220,726,252 people shows a weak positive correlation between the proportion of Latvians and percentage of population with at least 11th grade education in the United States with a correlation coefficient (R) of 0.230 and weighted average of 94.7%, a difference of 2.4%.
11th Grade Correlation Summary
| Measurement | Immigrants from Morocco | Latvian |
| Minimum | 86.1% | 89.1% |
| Maximum | 100.0% | 100.0% |
| Range | 13.9% | 10.9% |
| Mean | 93.2% | 97.4% |
| Median | 92.6% | 98.0% |
| Interquartile 25% (IQ1) | 91.0% | 95.8% |
| Interquartile 75% (IQ3) | 95.6% | 99.4% |
| Interquartile Range (IQR) | 4.7% | 3.6% |
| Standard Deviation (Sample) | 3.5% | 2.4% |
| Standard Deviation (Population) | 3.4% | 2.4% |
Similar Demographics by 11th Grade
Demographics Similar to Immigrants from Morocco by 11th Grade
In terms of 11th grade, the demographic groups most similar to Immigrants from Morocco are Immigrants from Malaysia (92.4%, a difference of 0.010%), Immigrants from Asia (92.4%, a difference of 0.010%), Creek (92.4%, a difference of 0.020%), Inupiat (92.4%, a difference of 0.020%), and Cherokee (92.4%, a difference of 0.020%).
| Demographics | Rating | Rank | 11th Grade |
| Shoshone | 48.9 /100 | #175 | Average 92.5% |
| Spaniards | 46.9 /100 | #176 | Average 92.5% |
| Guamanians/Chamorros | 45.0 /100 | #177 | Average 92.5% |
| Sudanese | 43.4 /100 | #178 | Average 92.5% |
| Creek | 40.9 /100 | #179 | Average 92.4% |
| Inupiat | 40.7 /100 | #180 | Average 92.4% |
| Cherokee | 40.7 /100 | #181 | Average 92.4% |
| Immigrants | Morocco | 38.6 /100 | #182 | Fair 92.4% |
| Immigrants | Malaysia | 37.6 /100 | #183 | Fair 92.4% |
| Immigrants | Asia | 37.4 /100 | #184 | Fair 92.4% |
| Immigrants | Nepal | 36.4 /100 | #185 | Fair 92.4% |
| Arapaho | 35.1 /100 | #186 | Fair 92.4% |
| Immigrants | Western Asia | 35.0 /100 | #187 | Fair 92.4% |
| Immigrants | Indonesia | 33.7 /100 | #188 | Fair 92.4% |
| Immigrants | Chile | 33.3 /100 | #189 | Fair 92.4% |
Demographics Similar to Latvians by 11th Grade
In terms of 11th grade, the demographic groups most similar to Latvians are Finnish (94.7%, a difference of 0.0%), German (94.7%, a difference of 0.0%), Chinese (94.6%, a difference of 0.030%), Danish (94.7%, a difference of 0.050%), and Croatian (94.7%, a difference of 0.090%).
| Demographics | Rating | Rank | 11th Grade |
| Carpatho Rusyns | 100.0 /100 | #5 | Exceptional 94.8% |
| Lithuanians | 100.0 /100 | #6 | Exceptional 94.8% |
| Poles | 100.0 /100 | #7 | Exceptional 94.8% |
| Croatians | 100.0 /100 | #8 | Exceptional 94.7% |
| Danes | 100.0 /100 | #9 | Exceptional 94.7% |
| Finns | 100.0 /100 | #10 | Exceptional 94.7% |
| Germans | 100.0 /100 | #11 | Exceptional 94.7% |
| Latvians | 100.0 /100 | #12 | Exceptional 94.7% |
| Chinese | 100.0 /100 | #13 | Exceptional 94.6% |
| Eastern Europeans | 100.0 /100 | #14 | Exceptional 94.6% |
| Bulgarians | 100.0 /100 | #15 | Exceptional 94.5% |
| Immigrants | India | 100.0 /100 | #16 | Exceptional 94.5% |
| Luxembourgers | 100.0 /100 | #17 | Exceptional 94.5% |
| Maltese | 100.0 /100 | #18 | Exceptional 94.5% |
| Scandinavians | 100.0 /100 | #19 | Exceptional 94.5% |