Hungarian vs Latvian Married-Couple Family Poverty
COMPARE
Hungarian
Latvian
Married-Couple Family Poverty
Married-Couple Family Poverty Comparison
Hungarians
Latvians
5.3%
MARRIED-COUPLE FAMILY POVERTY
34.7/ 100
METRIC RATING
186th/ 347
METRIC RANK
3.9%
MARRIED-COUPLE FAMILY POVERTY
100.0/ 100
METRIC RATING
7th/ 347
METRIC RANK
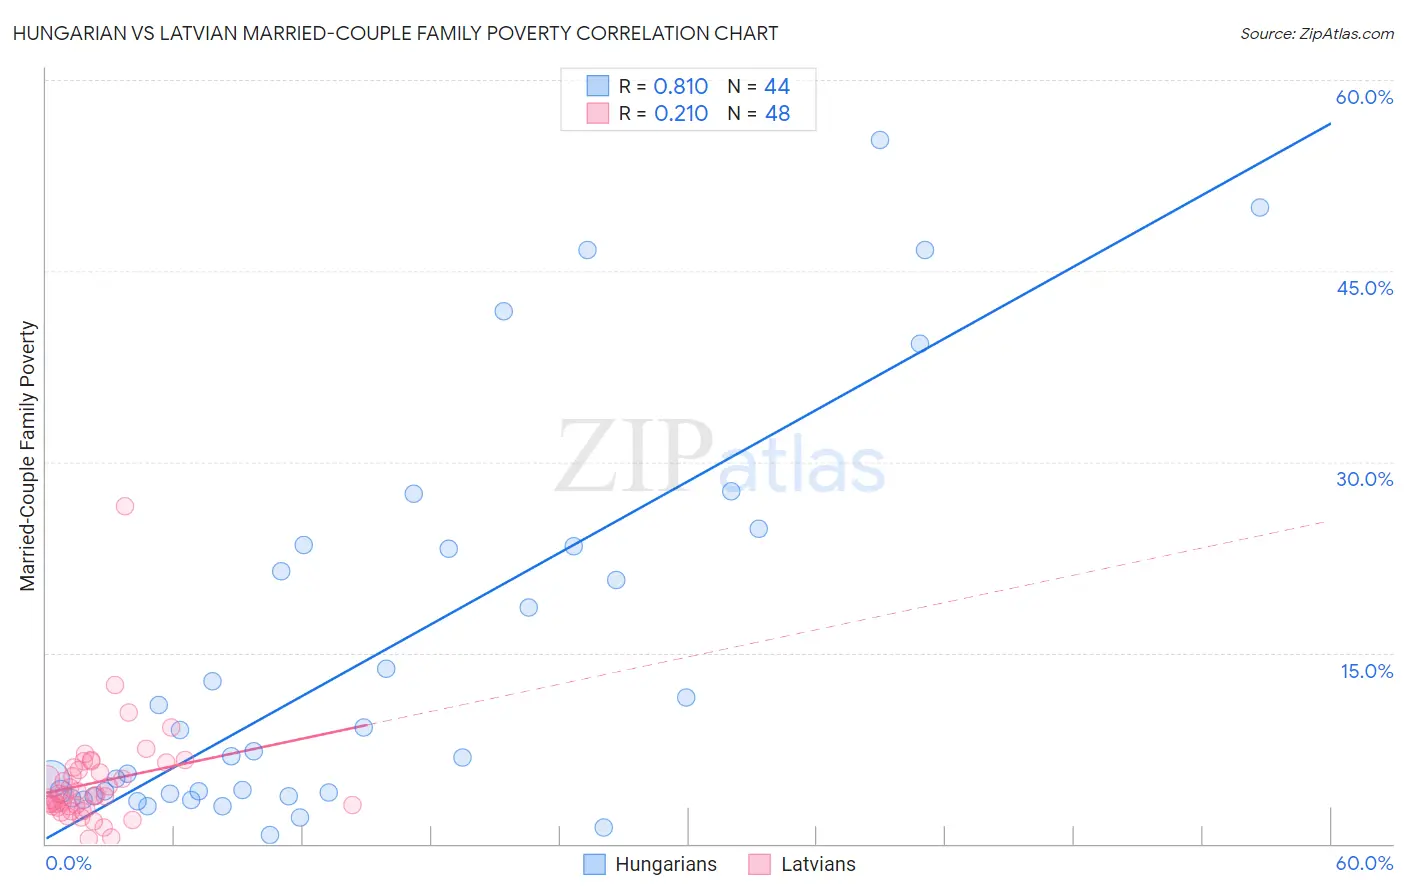
Hungarian vs Latvian Married-Couple Family Poverty Correlation Chart
The statistical analysis conducted on geographies consisting of 478,217,673 people shows a very strong positive correlation between the proportion of Hungarians and poverty level among married-couple families in the United States with a correlation coefficient (R) of 0.810 and weighted average of 5.3%. Similarly, the statistical analysis conducted on geographies consisting of 219,282,296 people shows a weak positive correlation between the proportion of Latvians and poverty level among married-couple families in the United States with a correlation coefficient (R) of 0.210 and weighted average of 3.9%, a difference of 36.3%.
Married-Couple Family Poverty Correlation Summary
| Measurement | Hungarian | Latvian |
| Minimum | 0.71% | 0.39% |
| Maximum | 55.3% | 26.5% |
| Range | 54.5% | 26.1% |
| Mean | 14.8% | 4.8% |
| Median | 7.0% | 3.8% |
| Interquartile 25% (IQ1) | 3.9% | 2.9% |
| Interquartile 75% (IQ3) | 23.3% | 5.9% |
| Interquartile Range (IQR) | 19.4% | 3.0% |
| Standard Deviation (Sample) | 15.1% | 4.0% |
| Standard Deviation (Population) | 14.9% | 3.9% |
Similar Demographics by Married-Couple Family Poverty
Demographics Similar to Hungarians by Married-Couple Family Poverty
In terms of married-couple family poverty, the demographic groups most similar to Hungarians are American (5.3%, a difference of 0.080%), Immigrants from Albania (5.3%, a difference of 0.11%), Nonimmigrants (5.3%, a difference of 0.13%), Israeli (5.3%, a difference of 0.20%), and South American Indian (5.3%, a difference of 0.29%).
| Demographics | Rating | Rank | Married-Couple Family Poverty |
| Spanish | 41.4 /100 | #179 | Average 5.3% |
| Immigrants | Sierra Leone | 39.3 /100 | #180 | Fair 5.3% |
| Immigrants | Chile | 38.8 /100 | #181 | Fair 5.3% |
| Immigrants | Vietnam | 37.7 /100 | #182 | Fair 5.3% |
| Peruvians | 37.6 /100 | #183 | Fair 5.3% |
| Immigrants | Nonimmigrants | 35.8 /100 | #184 | Fair 5.3% |
| Americans | 35.4 /100 | #185 | Fair 5.3% |
| Hungarians | 34.7 /100 | #186 | Fair 5.3% |
| Immigrants | Albania | 33.8 /100 | #187 | Fair 5.3% |
| Israelis | 33.1 /100 | #188 | Fair 5.3% |
| South American Indians | 32.5 /100 | #189 | Fair 5.3% |
| Ugandans | 31.6 /100 | #190 | Fair 5.3% |
| Immigrants | Cabo Verde | 30.9 /100 | #191 | Fair 5.3% |
| Cape Verdeans | 30.7 /100 | #192 | Fair 5.3% |
| Malaysians | 29.5 /100 | #193 | Fair 5.4% |
Demographics Similar to Latvians by Married-Couple Family Poverty
In terms of married-couple family poverty, the demographic groups most similar to Latvians are Luxembourger (3.9%, a difference of 0.52%), Thai (3.9%, a difference of 0.54%), Croatian (3.9%, a difference of 0.98%), Carpatho Rusyn (3.9%, a difference of 1.0%), and Swedish (3.9%, a difference of 1.1%).
| Demographics | Rating | Rank | Married-Couple Family Poverty |
| Immigrants | India | 100.0 /100 | #1 | Exceptional 3.6% |
| Chinese | 100.0 /100 | #2 | Exceptional 3.6% |
| Norwegians | 100.0 /100 | #3 | Exceptional 3.7% |
| Slovenes | 100.0 /100 | #4 | Exceptional 3.8% |
| Swedes | 100.0 /100 | #5 | Exceptional 3.9% |
| Luxembourgers | 100.0 /100 | #6 | Exceptional 3.9% |
| Latvians | 100.0 /100 | #7 | Exceptional 3.9% |
| Thais | 100.0 /100 | #8 | Exceptional 3.9% |
| Croatians | 100.0 /100 | #9 | Exceptional 3.9% |
| Carpatho Rusyns | 100.0 /100 | #10 | Exceptional 3.9% |
| Lithuanians | 100.0 /100 | #11 | Exceptional 4.0% |
| Bulgarians | 100.0 /100 | #12 | Exceptional 4.0% |
| Czechs | 100.0 /100 | #13 | Exceptional 4.0% |
| Slovaks | 100.0 /100 | #14 | Exceptional 4.0% |
| Poles | 100.0 /100 | #15 | Exceptional 4.0% |