Immigrants from Lithuania vs Alsatian Married-Couple Family Poverty
COMPARE
Immigrants from Lithuania
Alsatian
Married-Couple Family Poverty
Married-Couple Family Poverty Comparison
Immigrants from Lithuania
Alsatians
4.3%
MARRIED-COUPLE FAMILY POVERTY
99.7/ 100
METRIC RATING
51st/ 347
METRIC RANK
5.2%
MARRIED-COUPLE FAMILY POVERTY
51.2/ 100
METRIC RATING
173rd/ 347
METRIC RANK
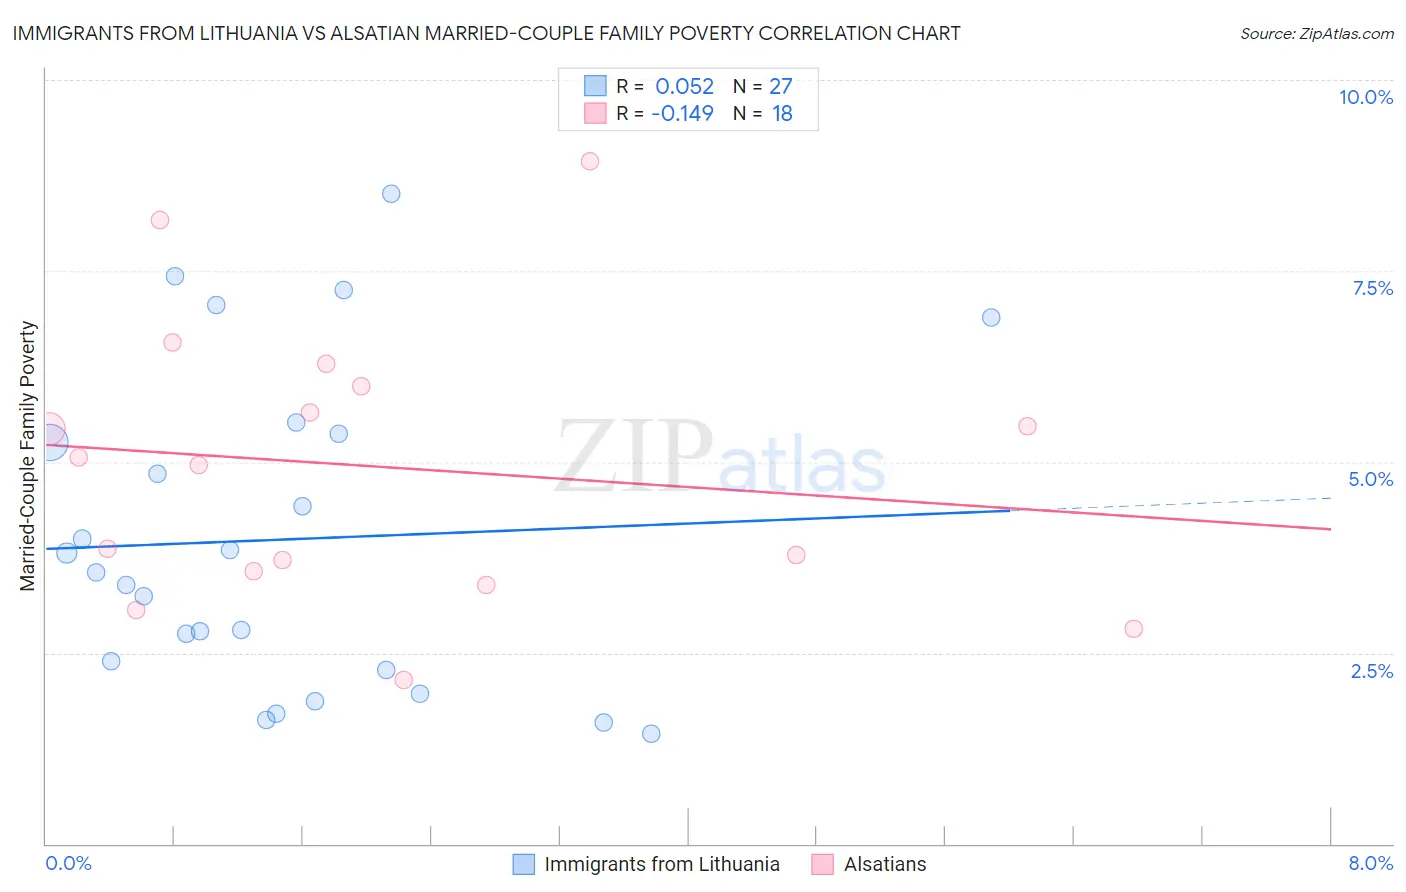
Immigrants from Lithuania vs Alsatian Married-Couple Family Poverty Correlation Chart
The statistical analysis conducted on geographies consisting of 117,432,978 people shows a slight positive correlation between the proportion of Immigrants from Lithuania and poverty level among married-couple families in the United States with a correlation coefficient (R) of 0.052 and weighted average of 4.3%. Similarly, the statistical analysis conducted on geographies consisting of 82,494,260 people shows a poor negative correlation between the proportion of Alsatians and poverty level among married-couple families in the United States with a correlation coefficient (R) of -0.149 and weighted average of 5.2%, a difference of 20.7%.
Married-Couple Family Poverty Correlation Summary
| Measurement | Immigrants from Lithuania | Alsatian |
| Minimum | 1.4% | 2.2% |
| Maximum | 8.5% | 8.9% |
| Range | 7.1% | 6.8% |
| Mean | 4.0% | 4.9% |
| Median | 3.6% | 5.0% |
| Interquartile 25% (IQ1) | 2.3% | 3.6% |
| Interquartile 75% (IQ3) | 5.4% | 6.0% |
| Interquartile Range (IQR) | 3.1% | 2.4% |
| Standard Deviation (Sample) | 2.1% | 1.8% |
| Standard Deviation (Population) | 2.0% | 1.8% |
Similar Demographics by Married-Couple Family Poverty
Demographics Similar to Immigrants from Lithuania by Married-Couple Family Poverty
In terms of married-couple family poverty, the demographic groups most similar to Immigrants from Lithuania are Burmese (4.3%, a difference of 0.010%), Russian (4.3%, a difference of 0.030%), Turkish (4.3%, a difference of 0.11%), Welsh (4.3%, a difference of 0.18%), and Australian (4.3%, a difference of 0.19%).
| Demographics | Rating | Rank | Married-Couple Family Poverty |
| Immigrants | Japan | 99.8 /100 | #44 | Exceptional 4.3% |
| Serbians | 99.8 /100 | #45 | Exceptional 4.3% |
| British | 99.8 /100 | #46 | Exceptional 4.3% |
| Immigrants | South Central Asia | 99.8 /100 | #47 | Exceptional 4.3% |
| Australians | 99.7 /100 | #48 | Exceptional 4.3% |
| Turks | 99.7 /100 | #49 | Exceptional 4.3% |
| Burmese | 99.7 /100 | #50 | Exceptional 4.3% |
| Immigrants | Lithuania | 99.7 /100 | #51 | Exceptional 4.3% |
| Russians | 99.7 /100 | #52 | Exceptional 4.3% |
| Welsh | 99.7 /100 | #53 | Exceptional 4.3% |
| Austrians | 99.7 /100 | #54 | Exceptional 4.3% |
| French | 99.7 /100 | #55 | Exceptional 4.3% |
| Immigrants | Zimbabwe | 99.7 /100 | #56 | Exceptional 4.3% |
| Immigrants | Netherlands | 99.7 /100 | #57 | Exceptional 4.3% |
| Czechoslovakians | 99.7 /100 | #58 | Exceptional 4.4% |
Demographics Similar to Alsatians by Married-Couple Family Poverty
In terms of married-couple family poverty, the demographic groups most similar to Alsatians are Immigrants from Northern Africa (5.2%, a difference of 0.020%), Immigrants from Eastern Africa (5.2%, a difference of 0.14%), Bermudan (5.2%, a difference of 0.20%), Immigrants from Argentina (5.2%, a difference of 0.37%), and Marshallese (5.2%, a difference of 0.38%).
| Demographics | Rating | Rank | Married-Couple Family Poverty |
| Paraguayans | 61.5 /100 | #166 | Good 5.1% |
| Costa Ricans | 61.5 /100 | #167 | Good 5.1% |
| Immigrants | Uganda | 54.9 /100 | #168 | Average 5.2% |
| Ottawa | 54.5 /100 | #169 | Average 5.2% |
| Immigrants | Argentina | 54.4 /100 | #170 | Average 5.2% |
| Bermudans | 52.9 /100 | #171 | Average 5.2% |
| Immigrants | Northern Africa | 51.3 /100 | #172 | Average 5.2% |
| Alsatians | 51.2 /100 | #173 | Average 5.2% |
| Immigrants | Eastern Africa | 50.0 /100 | #174 | Average 5.2% |
| Marshallese | 47.9 /100 | #175 | Average 5.2% |
| Menominee | 47.8 /100 | #176 | Average 5.2% |
| Immigrants | Kazakhstan | 45.1 /100 | #177 | Average 5.2% |
| Immigrants | Ukraine | 44.9 /100 | #178 | Average 5.2% |
| Spanish | 41.4 /100 | #179 | Average 5.3% |
| Immigrants | Sierra Leone | 39.3 /100 | #180 | Fair 5.3% |