Immigrants from Lithuania vs Cuban Married-Couple Family Poverty
COMPARE
Immigrants from Lithuania
Cuban
Married-Couple Family Poverty
Married-Couple Family Poverty Comparison
Immigrants from Lithuania
Cubans
4.3%
MARRIED-COUPLE FAMILY POVERTY
99.7/ 100
METRIC RATING
51st/ 347
METRIC RANK
6.8%
MARRIED-COUPLE FAMILY POVERTY
0.0/ 100
METRIC RATING
304th/ 347
METRIC RANK
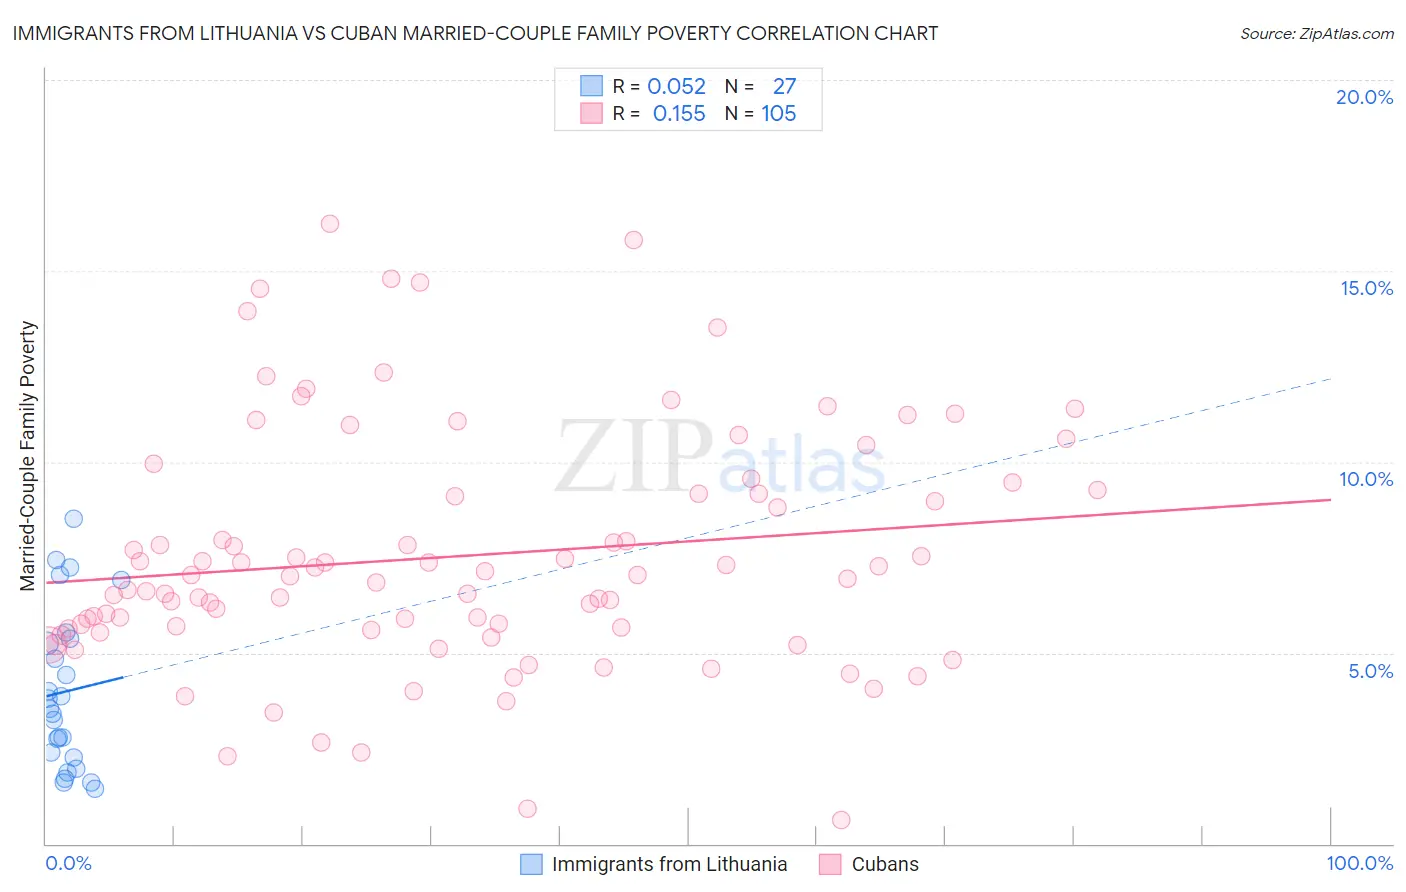
Immigrants from Lithuania vs Cuban Married-Couple Family Poverty Correlation Chart
The statistical analysis conducted on geographies consisting of 117,432,978 people shows a slight positive correlation between the proportion of Immigrants from Lithuania and poverty level among married-couple families in the United States with a correlation coefficient (R) of 0.052 and weighted average of 4.3%. Similarly, the statistical analysis conducted on geographies consisting of 444,866,425 people shows a poor positive correlation between the proportion of Cubans and poverty level among married-couple families in the United States with a correlation coefficient (R) of 0.155 and weighted average of 6.8%, a difference of 57.4%.
Married-Couple Family Poverty Correlation Summary
| Measurement | Immigrants from Lithuania | Cuban |
| Minimum | 1.4% | 0.61% |
| Maximum | 8.5% | 16.2% |
| Range | 7.1% | 15.6% |
| Mean | 4.0% | 7.5% |
| Median | 3.6% | 7.0% |
| Interquartile 25% (IQ1) | 2.3% | 5.6% |
| Interquartile 75% (IQ3) | 5.4% | 9.2% |
| Interquartile Range (IQR) | 3.1% | 3.6% |
| Standard Deviation (Sample) | 2.1% | 3.1% |
| Standard Deviation (Population) | 2.0% | 3.1% |
Similar Demographics by Married-Couple Family Poverty
Demographics Similar to Immigrants from Lithuania by Married-Couple Family Poverty
In terms of married-couple family poverty, the demographic groups most similar to Immigrants from Lithuania are Burmese (4.3%, a difference of 0.010%), Russian (4.3%, a difference of 0.030%), Turkish (4.3%, a difference of 0.11%), Welsh (4.3%, a difference of 0.18%), and Australian (4.3%, a difference of 0.19%).
| Demographics | Rating | Rank | Married-Couple Family Poverty |
| Immigrants | Japan | 99.8 /100 | #44 | Exceptional 4.3% |
| Serbians | 99.8 /100 | #45 | Exceptional 4.3% |
| British | 99.8 /100 | #46 | Exceptional 4.3% |
| Immigrants | South Central Asia | 99.8 /100 | #47 | Exceptional 4.3% |
| Australians | 99.7 /100 | #48 | Exceptional 4.3% |
| Turks | 99.7 /100 | #49 | Exceptional 4.3% |
| Burmese | 99.7 /100 | #50 | Exceptional 4.3% |
| Immigrants | Lithuania | 99.7 /100 | #51 | Exceptional 4.3% |
| Russians | 99.7 /100 | #52 | Exceptional 4.3% |
| Welsh | 99.7 /100 | #53 | Exceptional 4.3% |
| Austrians | 99.7 /100 | #54 | Exceptional 4.3% |
| French | 99.7 /100 | #55 | Exceptional 4.3% |
| Immigrants | Zimbabwe | 99.7 /100 | #56 | Exceptional 4.3% |
| Immigrants | Netherlands | 99.7 /100 | #57 | Exceptional 4.3% |
| Czechoslovakians | 99.7 /100 | #58 | Exceptional 4.4% |
Demographics Similar to Cubans by Married-Couple Family Poverty
In terms of married-couple family poverty, the demographic groups most similar to Cubans are Haitian (6.8%, a difference of 0.10%), Immigrants from El Salvador (6.8%, a difference of 0.44%), Immigrants from Ecuador (6.7%, a difference of 0.72%), Central American (6.7%, a difference of 0.86%), and Immigrants from Belize (6.7%, a difference of 1.5%).
| Demographics | Rating | Rank | Married-Couple Family Poverty |
| Kiowa | 0.0 /100 | #297 | Tragic 6.6% |
| Immigrants | Guyana | 0.0 /100 | #298 | Tragic 6.7% |
| Nicaraguans | 0.0 /100 | #299 | Tragic 6.7% |
| Immigrants | Belize | 0.0 /100 | #300 | Tragic 6.7% |
| Central Americans | 0.0 /100 | #301 | Tragic 6.7% |
| Immigrants | Ecuador | 0.0 /100 | #302 | Tragic 6.7% |
| Immigrants | El Salvador | 0.0 /100 | #303 | Tragic 6.8% |
| Cubans | 0.0 /100 | #304 | Tragic 6.8% |
| Haitians | 0.0 /100 | #305 | Tragic 6.8% |
| Immigrants | Haiti | 0.0 /100 | #306 | Tragic 7.0% |
| Guatemalans | 0.0 /100 | #307 | Tragic 7.0% |
| Spanish American Indians | 0.0 /100 | #308 | Tragic 7.1% |
| Hopi | 0.0 /100 | #309 | Tragic 7.1% |
| Immigrants | Nicaragua | 0.0 /100 | #310 | Tragic 7.1% |
| Immigrants | Dominica | 0.0 /100 | #311 | Tragic 7.1% |