Immigrants from Lithuania vs Immigrants from Nepal Married-Couple Family Poverty
COMPARE
Immigrants from Lithuania
Immigrants from Nepal
Married-Couple Family Poverty
Married-Couple Family Poverty Comparison
Immigrants from Lithuania
Immigrants from Nepal
4.3%
MARRIED-COUPLE FAMILY POVERTY
99.7/ 100
METRIC RATING
51st/ 347
METRIC RANK
4.7%
MARRIED-COUPLE FAMILY POVERTY
95.9/ 100
METRIC RATING
113th/ 347
METRIC RANK
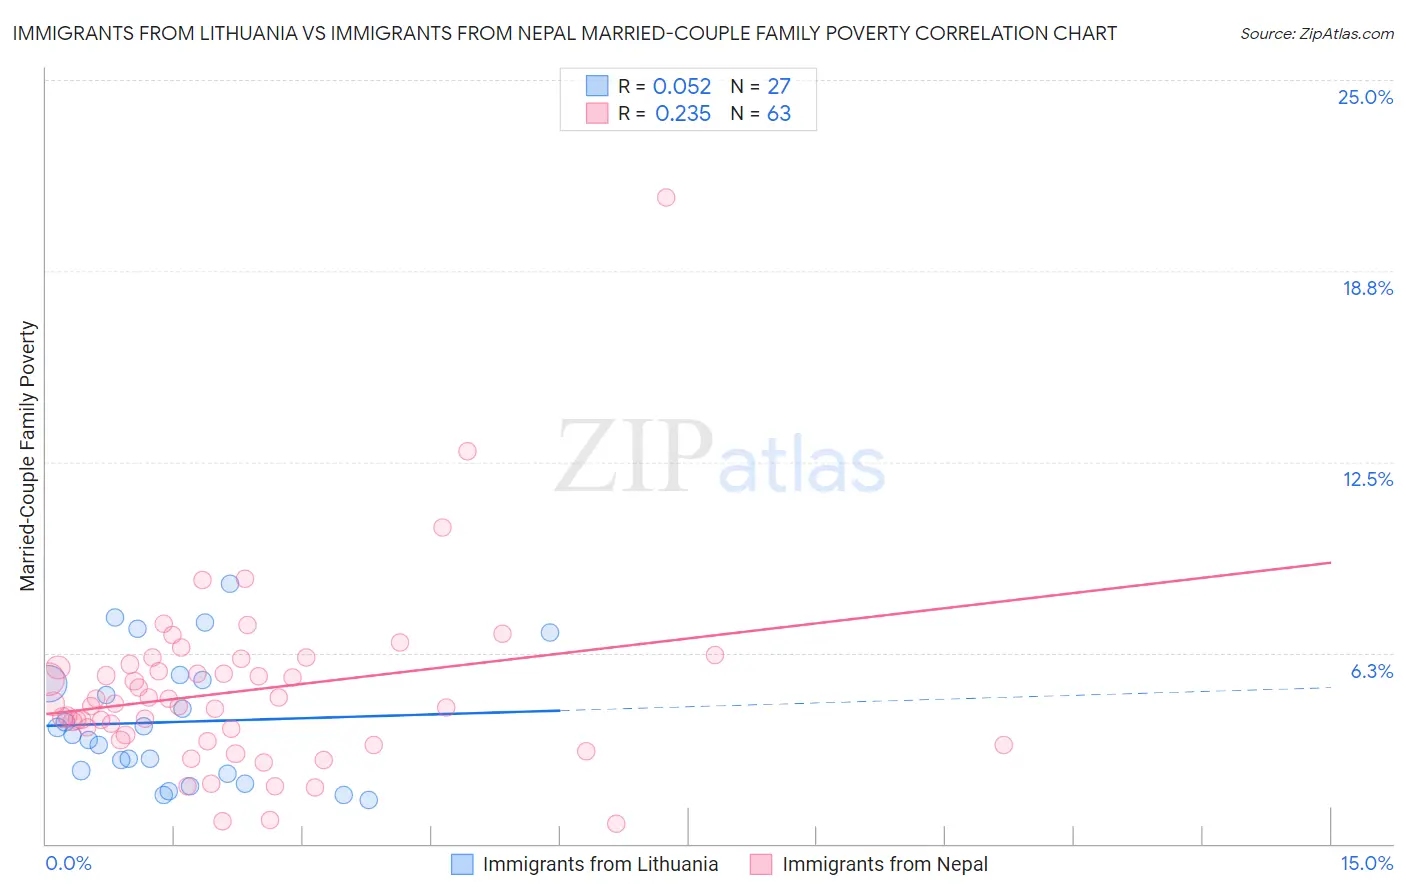
Immigrants from Lithuania vs Immigrants from Nepal Married-Couple Family Poverty Correlation Chart
The statistical analysis conducted on geographies consisting of 117,432,978 people shows a slight positive correlation between the proportion of Immigrants from Lithuania and poverty level among married-couple families in the United States with a correlation coefficient (R) of 0.052 and weighted average of 4.3%. Similarly, the statistical analysis conducted on geographies consisting of 185,979,517 people shows a weak positive correlation between the proportion of Immigrants from Nepal and poverty level among married-couple families in the United States with a correlation coefficient (R) of 0.235 and weighted average of 4.7%, a difference of 9.8%.
Married-Couple Family Poverty Correlation Summary
| Measurement | Immigrants from Lithuania | Immigrants from Nepal |
| Minimum | 1.4% | 0.67% |
| Maximum | 8.5% | 21.1% |
| Range | 7.1% | 20.5% |
| Mean | 4.0% | 5.0% |
| Median | 3.6% | 4.6% |
| Interquartile 25% (IQ1) | 2.3% | 3.4% |
| Interquartile 75% (IQ3) | 5.4% | 5.9% |
| Interquartile Range (IQR) | 3.1% | 2.5% |
| Standard Deviation (Sample) | 2.1% | 3.0% |
| Standard Deviation (Population) | 2.0% | 3.0% |
Similar Demographics by Married-Couple Family Poverty
Demographics Similar to Immigrants from Lithuania by Married-Couple Family Poverty
In terms of married-couple family poverty, the demographic groups most similar to Immigrants from Lithuania are Burmese (4.3%, a difference of 0.010%), Russian (4.3%, a difference of 0.030%), Turkish (4.3%, a difference of 0.11%), Welsh (4.3%, a difference of 0.18%), and Australian (4.3%, a difference of 0.19%).
| Demographics | Rating | Rank | Married-Couple Family Poverty |
| Immigrants | Japan | 99.8 /100 | #44 | Exceptional 4.3% |
| Serbians | 99.8 /100 | #45 | Exceptional 4.3% |
| British | 99.8 /100 | #46 | Exceptional 4.3% |
| Immigrants | South Central Asia | 99.8 /100 | #47 | Exceptional 4.3% |
| Australians | 99.7 /100 | #48 | Exceptional 4.3% |
| Turks | 99.7 /100 | #49 | Exceptional 4.3% |
| Burmese | 99.7 /100 | #50 | Exceptional 4.3% |
| Immigrants | Lithuania | 99.7 /100 | #51 | Exceptional 4.3% |
| Russians | 99.7 /100 | #52 | Exceptional 4.3% |
| Welsh | 99.7 /100 | #53 | Exceptional 4.3% |
| Austrians | 99.7 /100 | #54 | Exceptional 4.3% |
| French | 99.7 /100 | #55 | Exceptional 4.3% |
| Immigrants | Zimbabwe | 99.7 /100 | #56 | Exceptional 4.3% |
| Immigrants | Netherlands | 99.7 /100 | #57 | Exceptional 4.3% |
| Czechoslovakians | 99.7 /100 | #58 | Exceptional 4.4% |
Demographics Similar to Immigrants from Nepal by Married-Couple Family Poverty
In terms of married-couple family poverty, the demographic groups most similar to Immigrants from Nepal are Tongan (4.7%, a difference of 0.070%), Pakistani (4.7%, a difference of 0.25%), Immigrants from Bolivia (4.7%, a difference of 0.29%), Immigrants from Hong Kong (4.7%, a difference of 0.45%), and Immigrants from Indonesia (4.8%, a difference of 0.58%).
| Demographics | Rating | Rank | Married-Couple Family Poverty |
| Immigrants | France | 96.9 /100 | #106 | Exceptional 4.7% |
| Immigrants | Germany | 96.8 /100 | #107 | Exceptional 4.7% |
| Laotians | 96.6 /100 | #108 | Exceptional 4.7% |
| Immigrants | Hong Kong | 96.4 /100 | #109 | Exceptional 4.7% |
| Immigrants | Bolivia | 96.2 /100 | #110 | Exceptional 4.7% |
| Pakistanis | 96.2 /100 | #111 | Exceptional 4.7% |
| Tongans | 95.9 /100 | #112 | Exceptional 4.7% |
| Immigrants | Nepal | 95.9 /100 | #113 | Exceptional 4.7% |
| Immigrants | Indonesia | 95.1 /100 | #114 | Exceptional 4.8% |
| Taiwanese | 94.8 /100 | #115 | Exceptional 4.8% |
| Celtics | 94.8 /100 | #116 | Exceptional 4.8% |
| Kenyans | 94.7 /100 | #117 | Exceptional 4.8% |
| Immigrants | Philippines | 94.6 /100 | #118 | Exceptional 4.8% |
| Immigrants | Eastern Asia | 94.0 /100 | #119 | Exceptional 4.8% |
| Immigrants | Southern Europe | 93.4 /100 | #120 | Exceptional 4.8% |