Immigrants from Bulgaria vs Alsatian Married-Couple Family Poverty
COMPARE
Immigrants from Bulgaria
Alsatian
Married-Couple Family Poverty
Married-Couple Family Poverty Comparison
Immigrants from Bulgaria
Alsatians
4.4%
MARRIED-COUPLE FAMILY POVERTY
99.5/ 100
METRIC RATING
64th/ 347
METRIC RANK
5.2%
MARRIED-COUPLE FAMILY POVERTY
51.2/ 100
METRIC RATING
173rd/ 347
METRIC RANK
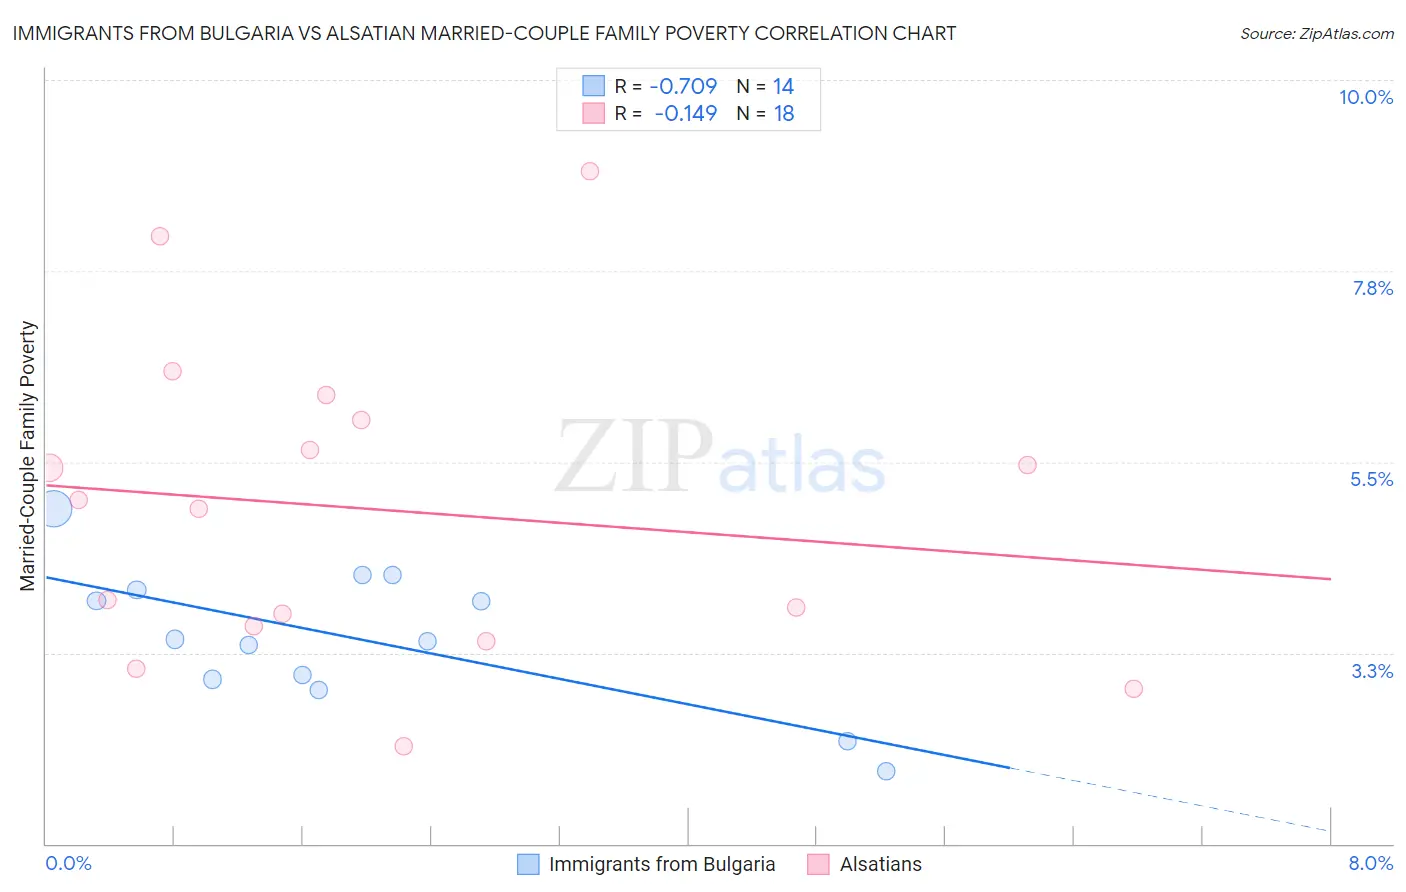
Immigrants from Bulgaria vs Alsatian Married-Couple Family Poverty Correlation Chart
The statistical analysis conducted on geographies consisting of 171,925,932 people shows a strong negative correlation between the proportion of Immigrants from Bulgaria and poverty level among married-couple families in the United States with a correlation coefficient (R) of -0.709 and weighted average of 4.4%. Similarly, the statistical analysis conducted on geographies consisting of 82,494,260 people shows a poor negative correlation between the proportion of Alsatians and poverty level among married-couple families in the United States with a correlation coefficient (R) of -0.149 and weighted average of 5.2%, a difference of 18.0%.
Married-Couple Family Poverty Correlation Summary
| Measurement | Immigrants from Bulgaria | Alsatian |
| Minimum | 1.9% | 2.2% |
| Maximum | 4.9% | 8.9% |
| Range | 3.1% | 6.8% |
| Mean | 3.4% | 4.9% |
| Median | 3.4% | 5.0% |
| Interquartile 25% (IQ1) | 2.9% | 3.6% |
| Interquartile 75% (IQ3) | 4.0% | 6.0% |
| Interquartile Range (IQR) | 1.1% | 2.4% |
| Standard Deviation (Sample) | 0.83% | 1.8% |
| Standard Deviation (Population) | 0.80% | 1.8% |
Similar Demographics by Married-Couple Family Poverty
Demographics Similar to Immigrants from Bulgaria by Married-Couple Family Poverty
In terms of married-couple family poverty, the demographic groups most similar to Immigrants from Bulgaria are Immigrants from Sri Lanka (4.4%, a difference of 0.41%), Macedonian (4.4%, a difference of 0.47%), Immigrants from Serbia (4.4%, a difference of 0.60%), Immigrants from Canada (4.4%, a difference of 0.65%), and Slavic (4.4%, a difference of 0.66%).
| Demographics | Rating | Rank | Married-Couple Family Poverty |
| Immigrants | Netherlands | 99.7 /100 | #57 | Exceptional 4.3% |
| Czechoslovakians | 99.7 /100 | #58 | Exceptional 4.4% |
| Immigrants | Sweden | 99.6 /100 | #59 | Exceptional 4.4% |
| Tlingit-Haida | 99.6 /100 | #60 | Exceptional 4.4% |
| Okinawans | 99.6 /100 | #61 | Exceptional 4.4% |
| Immigrants | Australia | 99.6 /100 | #62 | Exceptional 4.4% |
| Immigrants | Sri Lanka | 99.6 /100 | #63 | Exceptional 4.4% |
| Immigrants | Bulgaria | 99.5 /100 | #64 | Exceptional 4.4% |
| Macedonians | 99.4 /100 | #65 | Exceptional 4.4% |
| Immigrants | Serbia | 99.4 /100 | #66 | Exceptional 4.4% |
| Immigrants | Canada | 99.4 /100 | #67 | Exceptional 4.4% |
| Slavs | 99.4 /100 | #68 | Exceptional 4.4% |
| New Zealanders | 99.4 /100 | #69 | Exceptional 4.4% |
| Immigrants | Korea | 99.4 /100 | #70 | Exceptional 4.5% |
| Immigrants | North America | 99.3 /100 | #71 | Exceptional 4.5% |
Demographics Similar to Alsatians by Married-Couple Family Poverty
In terms of married-couple family poverty, the demographic groups most similar to Alsatians are Immigrants from Northern Africa (5.2%, a difference of 0.020%), Immigrants from Eastern Africa (5.2%, a difference of 0.14%), Bermudan (5.2%, a difference of 0.20%), Immigrants from Argentina (5.2%, a difference of 0.37%), and Marshallese (5.2%, a difference of 0.38%).
| Demographics | Rating | Rank | Married-Couple Family Poverty |
| Paraguayans | 61.5 /100 | #166 | Good 5.1% |
| Costa Ricans | 61.5 /100 | #167 | Good 5.1% |
| Immigrants | Uganda | 54.9 /100 | #168 | Average 5.2% |
| Ottawa | 54.5 /100 | #169 | Average 5.2% |
| Immigrants | Argentina | 54.4 /100 | #170 | Average 5.2% |
| Bermudans | 52.9 /100 | #171 | Average 5.2% |
| Immigrants | Northern Africa | 51.3 /100 | #172 | Average 5.2% |
| Alsatians | 51.2 /100 | #173 | Average 5.2% |
| Immigrants | Eastern Africa | 50.0 /100 | #174 | Average 5.2% |
| Marshallese | 47.9 /100 | #175 | Average 5.2% |
| Menominee | 47.8 /100 | #176 | Average 5.2% |
| Immigrants | Kazakhstan | 45.1 /100 | #177 | Average 5.2% |
| Immigrants | Ukraine | 44.9 /100 | #178 | Average 5.2% |
| Spanish | 41.4 /100 | #179 | Average 5.3% |
| Immigrants | Sierra Leone | 39.3 /100 | #180 | Fair 5.3% |