Immigrants from Lithuania vs Alsatian Births to Unmarried Women
COMPARE
Immigrants from Lithuania
Alsatian
Births to Unmarried Women
Births to Unmarried Women Comparison
Immigrants from Lithuania
Alsatians
27.7%
BIRTHS TO UNMARRIED WOMEN
99.5/ 100
METRIC RATING
46th/ 347
METRIC RANK
33.8%
BIRTHS TO UNMARRIED WOMEN
5.4/ 100
METRIC RATING
219th/ 347
METRIC RANK
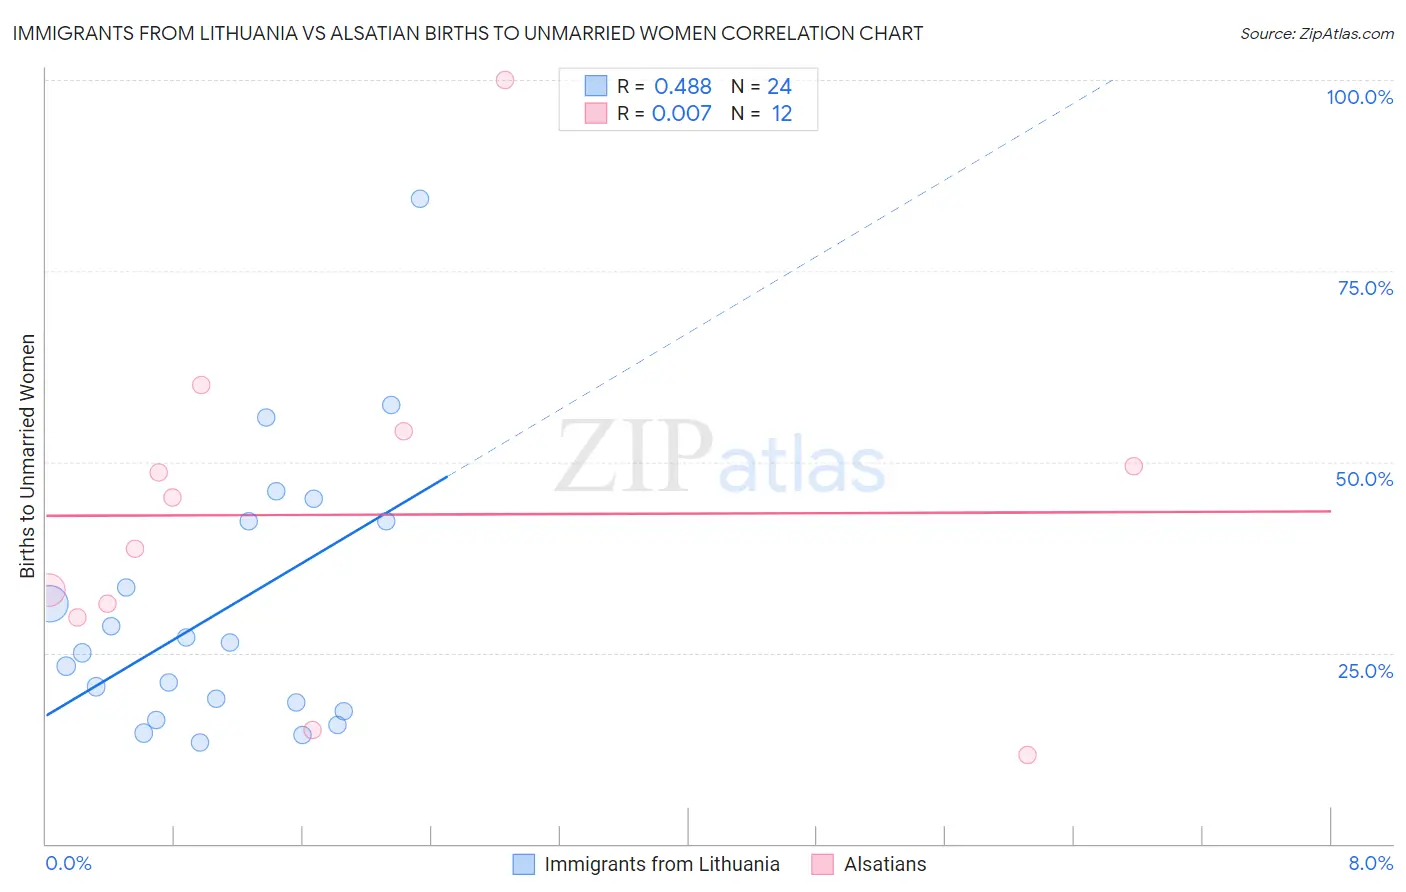
Immigrants from Lithuania vs Alsatian Births to Unmarried Women Correlation Chart
The statistical analysis conducted on geographies consisting of 112,678,576 people shows a moderate positive correlation between the proportion of Immigrants from Lithuania and percentage of births to unmarried women in the United States with a correlation coefficient (R) of 0.488 and weighted average of 27.7%. Similarly, the statistical analysis conducted on geographies consisting of 80,154,894 people shows no correlation between the proportion of Alsatians and percentage of births to unmarried women in the United States with a correlation coefficient (R) of 0.007 and weighted average of 33.8%, a difference of 21.9%.
Births to Unmarried Women Correlation Summary
| Measurement | Immigrants from Lithuania | Alsatian |
| Minimum | 13.2% | 11.7% |
| Maximum | 84.4% | 100.0% |
| Range | 71.3% | 88.3% |
| Mean | 30.8% | 43.1% |
| Median | 25.7% | 42.0% |
| Interquartile 25% (IQ1) | 17.9% | 30.5% |
| Interquartile 75% (IQ3) | 42.3% | 51.7% |
| Interquartile Range (IQR) | 24.4% | 21.2% |
| Standard Deviation (Sample) | 17.5% | 23.2% |
| Standard Deviation (Population) | 17.1% | 22.2% |
Similar Demographics by Births to Unmarried Women
Demographics Similar to Immigrants from Lithuania by Births to Unmarried Women
In terms of births to unmarried women, the demographic groups most similar to Immigrants from Lithuania are Hmong (27.7%, a difference of 0.0%), Eastern European (27.7%, a difference of 0.010%), Latvian (27.7%, a difference of 0.040%), Immigrants from Indonesia (27.7%, a difference of 0.14%), and Immigrants from Greece (27.8%, a difference of 0.20%).
| Demographics | Rating | Rank | Births to Unmarried Women |
| Immigrants | Malaysia | 99.7 /100 | #39 | Exceptional 27.4% |
| Turks | 99.6 /100 | #40 | Exceptional 27.4% |
| Iraqis | 99.6 /100 | #41 | Exceptional 27.6% |
| Immigrants | Eastern Europe | 99.6 /100 | #42 | Exceptional 27.6% |
| Immigrants | Bulgaria | 99.6 /100 | #43 | Exceptional 27.6% |
| Immigrants | Indonesia | 99.5 /100 | #44 | Exceptional 27.7% |
| Latvians | 99.5 /100 | #45 | Exceptional 27.7% |
| Immigrants | Lithuania | 99.5 /100 | #46 | Exceptional 27.7% |
| Hmong | 99.5 /100 | #47 | Exceptional 27.7% |
| Eastern Europeans | 99.5 /100 | #48 | Exceptional 27.7% |
| Immigrants | Greece | 99.4 /100 | #49 | Exceptional 27.8% |
| Maltese | 99.4 /100 | #50 | Exceptional 27.8% |
| Macedonians | 99.4 /100 | #51 | Exceptional 27.9% |
| Bhutanese | 99.4 /100 | #52 | Exceptional 27.9% |
| Immigrants | Romania | 99.4 /100 | #53 | Exceptional 27.9% |
Demographics Similar to Alsatians by Births to Unmarried Women
In terms of births to unmarried women, the demographic groups most similar to Alsatians are Portuguese (33.8%, a difference of 0.020%), Malaysian (33.9%, a difference of 0.19%), Immigrants from Ecuador (33.7%, a difference of 0.22%), Immigrants from Uruguay (33.9%, a difference of 0.26%), and Pennsylvania German (34.0%, a difference of 0.55%).
| Demographics | Rating | Rank | Births to Unmarried Women |
| Celtics | 10.2 /100 | #212 | Poor 33.3% |
| Immigrants | Costa Rica | 9.5 /100 | #213 | Tragic 33.4% |
| Slovaks | 9.3 /100 | #214 | Tragic 33.4% |
| French | 8.7 /100 | #215 | Tragic 33.4% |
| Nepalese | 7.8 /100 | #216 | Tragic 33.5% |
| Spaniards | 7.0 /100 | #217 | Tragic 33.6% |
| Immigrants | Ecuador | 5.9 /100 | #218 | Tragic 33.7% |
| Alsatians | 5.4 /100 | #219 | Tragic 33.8% |
| Portuguese | 5.4 /100 | #220 | Tragic 33.8% |
| Malaysians | 5.0 /100 | #221 | Tragic 33.9% |
| Immigrants | Uruguay | 4.8 /100 | #222 | Tragic 33.9% |
| Pennsylvania Germans | 4.3 /100 | #223 | Tragic 34.0% |
| Immigrants | Laos | 4.3 /100 | #224 | Tragic 34.0% |
| Spanish | 4.0 /100 | #225 | Tragic 34.1% |
| Delaware | 3.3 /100 | #226 | Tragic 34.2% |