Immigrants from Kuwait vs Comanche Householder Income Ages 25 - 44 years
COMPARE
Immigrants from Kuwait
Comanche
Householder Income Ages 25 - 44 years
Householder Income Ages 25 - 44 years Comparison
Immigrants from Kuwait
Comanche
$98,122
HOUSEHOLDER INCOME AGES 25 - 44 YEARS
87.8/ 100
METRIC RATING
130th/ 347
METRIC RANK
$82,152
HOUSEHOLDER INCOME AGES 25 - 44 YEARS
0.1/ 100
METRIC RATING
288th/ 347
METRIC RANK
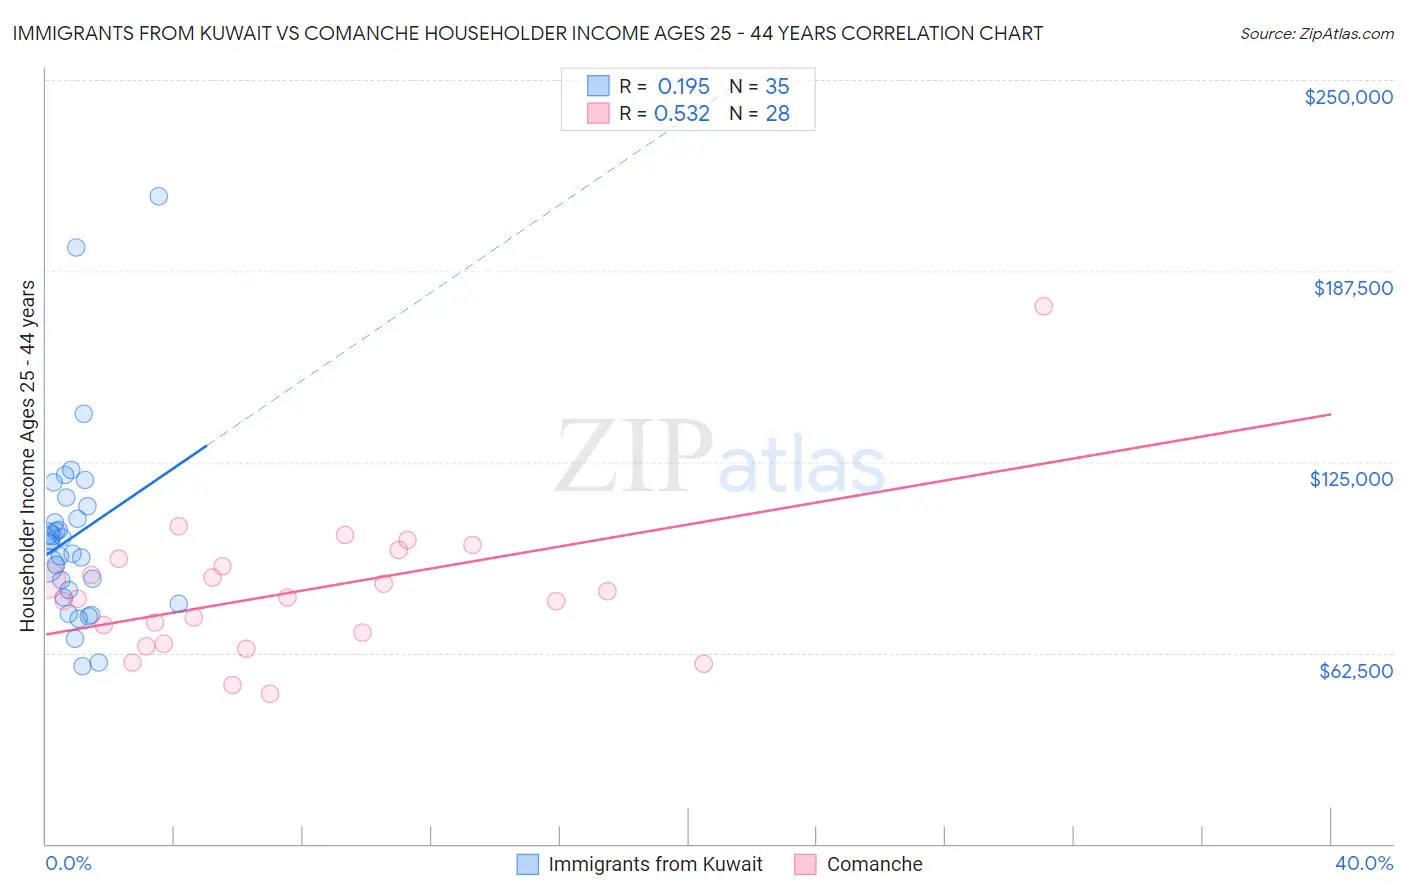
Immigrants from Kuwait vs Comanche Householder Income Ages 25 - 44 years Correlation Chart
The statistical analysis conducted on geographies consisting of 136,849,136 people shows a poor positive correlation between the proportion of Immigrants from Kuwait and household income with householder between the ages 25 and 44 in the United States with a correlation coefficient (R) of 0.195 and weighted average of $98,122. Similarly, the statistical analysis conducted on geographies consisting of 109,664,910 people shows a substantial positive correlation between the proportion of Comanche and household income with householder between the ages 25 and 44 in the United States with a correlation coefficient (R) of 0.532 and weighted average of $82,152, a difference of 19.4%.
Householder Income Ages 25 - 44 years Correlation Summary
| Measurement | Immigrants from Kuwait | Comanche |
| Minimum | $58,000 | $49,171 |
| Maximum | $211,833 | $176,131 |
| Range | $153,833 | $126,960 |
| Mean | $100,890 | $82,424 |
| Median | $98,273 | $80,487 |
| Interquartile 25% (IQ1) | $80,635 | $67,374 |
| Interquartile 75% (IQ3) | $110,365 | $92,050 |
| Interquartile Range (IQR) | $29,730 | $24,676 |
| Standard Deviation (Sample) | $31,630 | $23,672 |
| Standard Deviation (Population) | $31,175 | $23,245 |
Similar Demographics by Householder Income Ages 25 - 44 years
Demographics Similar to Immigrants from Kuwait by Householder Income Ages 25 - 44 years
In terms of householder income ages 25 - 44 years, the demographic groups most similar to Immigrants from Kuwait are Brazilian ($98,267, a difference of 0.15%), European ($98,310, a difference of 0.19%), Serbian ($98,320, a difference of 0.20%), Immigrants from Albania ($97,929, a difference of 0.20%), and British ($98,359, a difference of 0.24%).
| Demographics | Rating | Rank | Householder Income Ages 25 - 44 years |
| Palestinians | 91.2 /100 | #123 | Exceptional $98,777 |
| Zimbabweans | 90.3 /100 | #124 | Exceptional $98,586 |
| Pakistanis | 89.3 /100 | #125 | Excellent $98,401 |
| British | 89.1 /100 | #126 | Excellent $98,359 |
| Serbians | 88.9 /100 | #127 | Excellent $98,320 |
| Europeans | 88.9 /100 | #128 | Excellent $98,310 |
| Brazilians | 88.6 /100 | #129 | Excellent $98,267 |
| Immigrants | Kuwait | 87.8 /100 | #130 | Excellent $98,122 |
| Immigrants | Albania | 86.6 /100 | #131 | Excellent $97,929 |
| Immigrants | Zimbabwe | 86.3 /100 | #132 | Excellent $97,880 |
| Tsimshian | 85.8 /100 | #133 | Excellent $97,809 |
| Canadians | 84.5 /100 | #134 | Excellent $97,625 |
| Immigrants | Oceania | 84.5 /100 | #135 | Excellent $97,623 |
| Hungarians | 83.9 /100 | #136 | Excellent $97,544 |
| Lebanese | 82.3 /100 | #137 | Excellent $97,339 |
Demographics Similar to Comanche by Householder Income Ages 25 - 44 years
In terms of householder income ages 25 - 44 years, the demographic groups most similar to Comanche are Ute ($82,166, a difference of 0.020%), Immigrants from Latin America ($82,166, a difference of 0.020%), Immigrants from Somalia ($82,188, a difference of 0.040%), Shoshone ($82,062, a difference of 0.11%), and Immigrants from Middle Africa ($82,254, a difference of 0.12%).
| Demographics | Rating | Rank | Householder Income Ages 25 - 44 years |
| Cajuns | 0.1 /100 | #281 | Tragic $82,393 |
| Central American Indians | 0.1 /100 | #282 | Tragic $82,355 |
| Guatemalans | 0.1 /100 | #283 | Tragic $82,331 |
| Immigrants | Middle Africa | 0.1 /100 | #284 | Tragic $82,254 |
| Immigrants | Somalia | 0.1 /100 | #285 | Tragic $82,188 |
| Ute | 0.1 /100 | #286 | Tragic $82,166 |
| Immigrants | Latin America | 0.1 /100 | #287 | Tragic $82,166 |
| Comanche | 0.1 /100 | #288 | Tragic $82,152 |
| Shoshone | 0.1 /100 | #289 | Tragic $82,062 |
| Liberians | 0.1 /100 | #290 | Tragic $82,005 |
| Potawatomi | 0.1 /100 | #291 | Tragic $81,774 |
| Yaqui | 0.1 /100 | #292 | Tragic $81,656 |
| Blackfeet | 0.1 /100 | #293 | Tragic $81,531 |
| Cubans | 0.1 /100 | #294 | Tragic $81,483 |
| Bangladeshis | 0.1 /100 | #295 | Tragic $81,363 |