Immigrants from Kuwait vs Immigrants from Norway Married-Couple Family Poverty
COMPARE
Immigrants from Kuwait
Immigrants from Norway
Married-Couple Family Poverty
Married-Couple Family Poverty Comparison
Immigrants from Kuwait
Immigrants from Norway
5.0%
MARRIED-COUPLE FAMILY POVERTY
76.3/ 100
METRIC RATING
153rd/ 347
METRIC RANK
4.6%
MARRIED-COUPLE FAMILY POVERTY
98.4/ 100
METRIC RATING
92nd/ 347
METRIC RANK
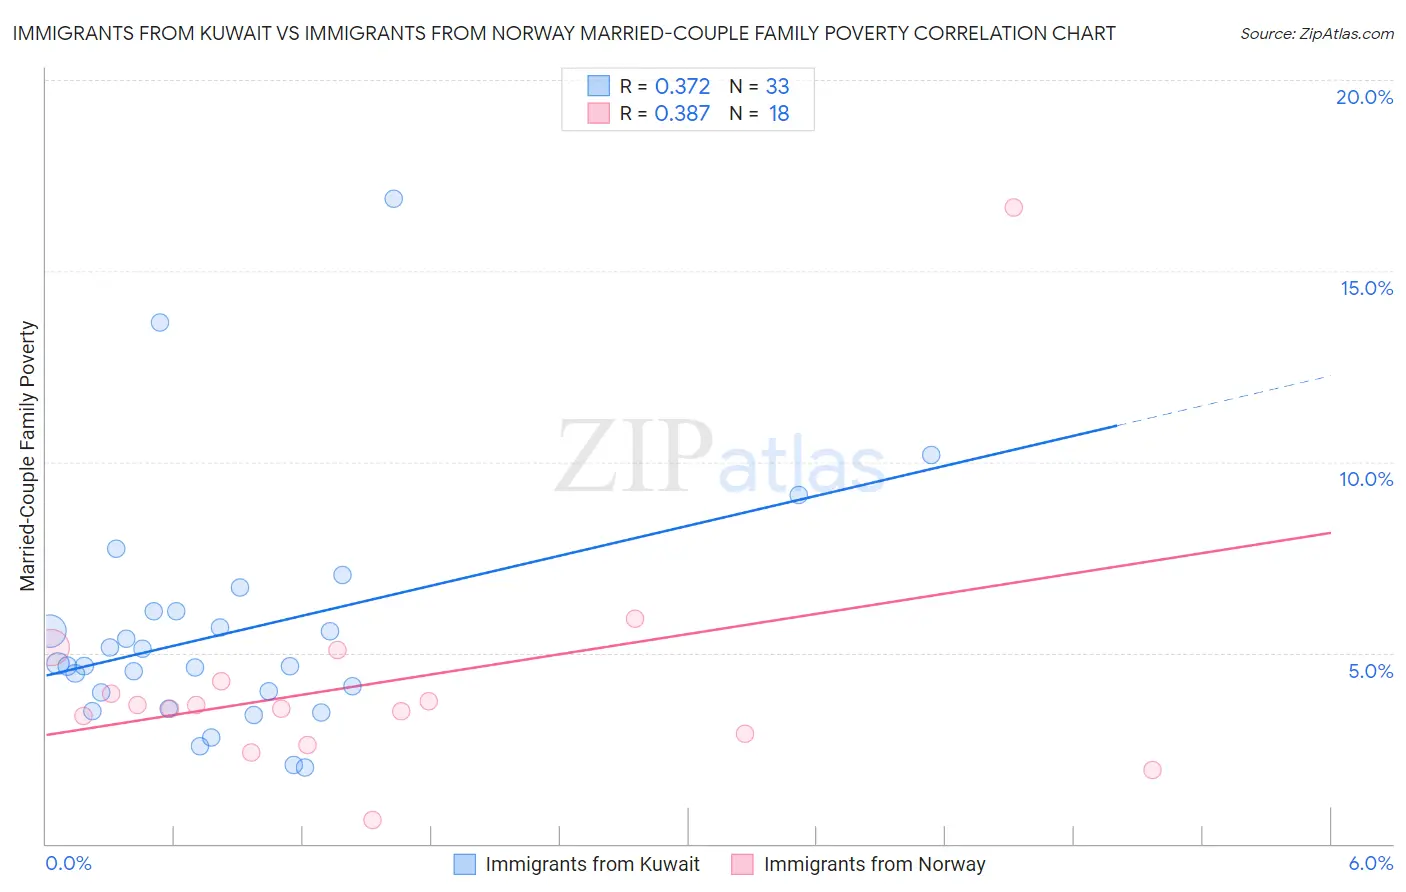
Immigrants from Kuwait vs Immigrants from Norway Married-Couple Family Poverty Correlation Chart
The statistical analysis conducted on geographies consisting of 136,568,646 people shows a mild positive correlation between the proportion of Immigrants from Kuwait and poverty level among married-couple families in the United States with a correlation coefficient (R) of 0.372 and weighted average of 5.0%. Similarly, the statistical analysis conducted on geographies consisting of 116,278,414 people shows a mild positive correlation between the proportion of Immigrants from Norway and poverty level among married-couple families in the United States with a correlation coefficient (R) of 0.387 and weighted average of 4.6%, a difference of 9.8%.
Married-Couple Family Poverty Correlation Summary
| Measurement | Immigrants from Kuwait | Immigrants from Norway |
| Minimum | 2.0% | 0.62% |
| Maximum | 16.9% | 16.7% |
| Range | 14.9% | 16.1% |
| Mean | 5.6% | 4.2% |
| Median | 4.7% | 3.6% |
| Interquartile 25% (IQ1) | 3.8% | 2.9% |
| Interquartile 75% (IQ3) | 6.1% | 4.2% |
| Interquartile Range (IQR) | 2.3% | 1.4% |
| Standard Deviation (Sample) | 3.1% | 3.3% |
| Standard Deviation (Population) | 3.1% | 3.2% |
Similar Demographics by Married-Couple Family Poverty
Demographics Similar to Immigrants from Kuwait by Married-Couple Family Poverty
In terms of married-couple family poverty, the demographic groups most similar to Immigrants from Kuwait are Albanian (5.0%, a difference of 0.15%), Immigrants from Cameroon (5.0%, a difference of 0.16%), Brazilian (5.0%, a difference of 0.33%), Immigrants from Oceania (5.0%, a difference of 0.38%), and Syrian (5.0%, a difference of 0.41%).
| Demographics | Rating | Rank | Married-Couple Family Poverty |
| Mongolians | 79.8 /100 | #146 | Good 5.0% |
| Syrians | 78.7 /100 | #147 | Good 5.0% |
| Immigrants | Russia | 78.7 /100 | #148 | Good 5.0% |
| Immigrants | Oceania | 78.6 /100 | #149 | Good 5.0% |
| Brazilians | 78.3 /100 | #150 | Good 5.0% |
| Immigrants | Cameroon | 77.3 /100 | #151 | Good 5.0% |
| Albanians | 77.2 /100 | #152 | Good 5.0% |
| Immigrants | Kuwait | 76.3 /100 | #153 | Good 5.0% |
| Delaware | 73.7 /100 | #154 | Good 5.1% |
| Immigrants | Ethiopia | 72.4 /100 | #155 | Good 5.1% |
| Sri Lankans | 72.2 /100 | #156 | Good 5.1% |
| Argentineans | 70.7 /100 | #157 | Good 5.1% |
| Immigrants | South Eastern Asia | 70.4 /100 | #158 | Good 5.1% |
| Immigrants | Saudi Arabia | 70.3 /100 | #159 | Good 5.1% |
| Pennsylvania Germans | 68.5 /100 | #160 | Good 5.1% |
Demographics Similar to Immigrants from Norway by Married-Couple Family Poverty
In terms of married-couple family poverty, the demographic groups most similar to Immigrants from Norway are Basque (4.6%, a difference of 0.080%), Immigrants from Switzerland (4.6%, a difference of 0.11%), Immigrants from Czechoslovakia (4.6%, a difference of 0.18%), Korean (4.6%, a difference of 0.18%), and Immigrants from Italy (4.6%, a difference of 0.23%).
| Demographics | Rating | Rank | Married-Couple Family Poverty |
| South Africans | 98.7 /100 | #85 | Exceptional 4.6% |
| Immigrants | Turkey | 98.6 /100 | #86 | Exceptional 4.6% |
| Immigrants | North Macedonia | 98.6 /100 | #87 | Exceptional 4.6% |
| Bolivians | 98.6 /100 | #88 | Exceptional 4.6% |
| Immigrants | Czechoslovakia | 98.5 /100 | #89 | Exceptional 4.6% |
| Immigrants | Switzerland | 98.5 /100 | #90 | Exceptional 4.6% |
| Basques | 98.5 /100 | #91 | Exceptional 4.6% |
| Immigrants | Norway | 98.4 /100 | #92 | Exceptional 4.6% |
| Koreans | 98.3 /100 | #93 | Exceptional 4.6% |
| Immigrants | Italy | 98.3 /100 | #94 | Exceptional 4.6% |
| Portuguese | 98.3 /100 | #95 | Exceptional 4.6% |
| Immigrants | Poland | 98.3 /100 | #96 | Exceptional 4.6% |
| Immigrants | Belgium | 98.2 /100 | #97 | Exceptional 4.6% |
| Native Hawaiians | 98.0 /100 | #98 | Exceptional 4.6% |
| Immigrants | Europe | 97.9 /100 | #99 | Exceptional 4.6% |