Immigrants from Italy vs Immigrants from Armenia Single Female Poverty
COMPARE
Immigrants from Italy
Immigrants from Armenia
Single Female Poverty
Single Female Poverty Comparison
Immigrants from Italy
Immigrants from Armenia
19.0%
SINGLE FEMALE POVERTY
99.8/ 100
METRIC RATING
51st/ 347
METRIC RANK
18.7%
SINGLE FEMALE POVERTY
99.9/ 100
METRIC RATING
37th/ 347
METRIC RANK
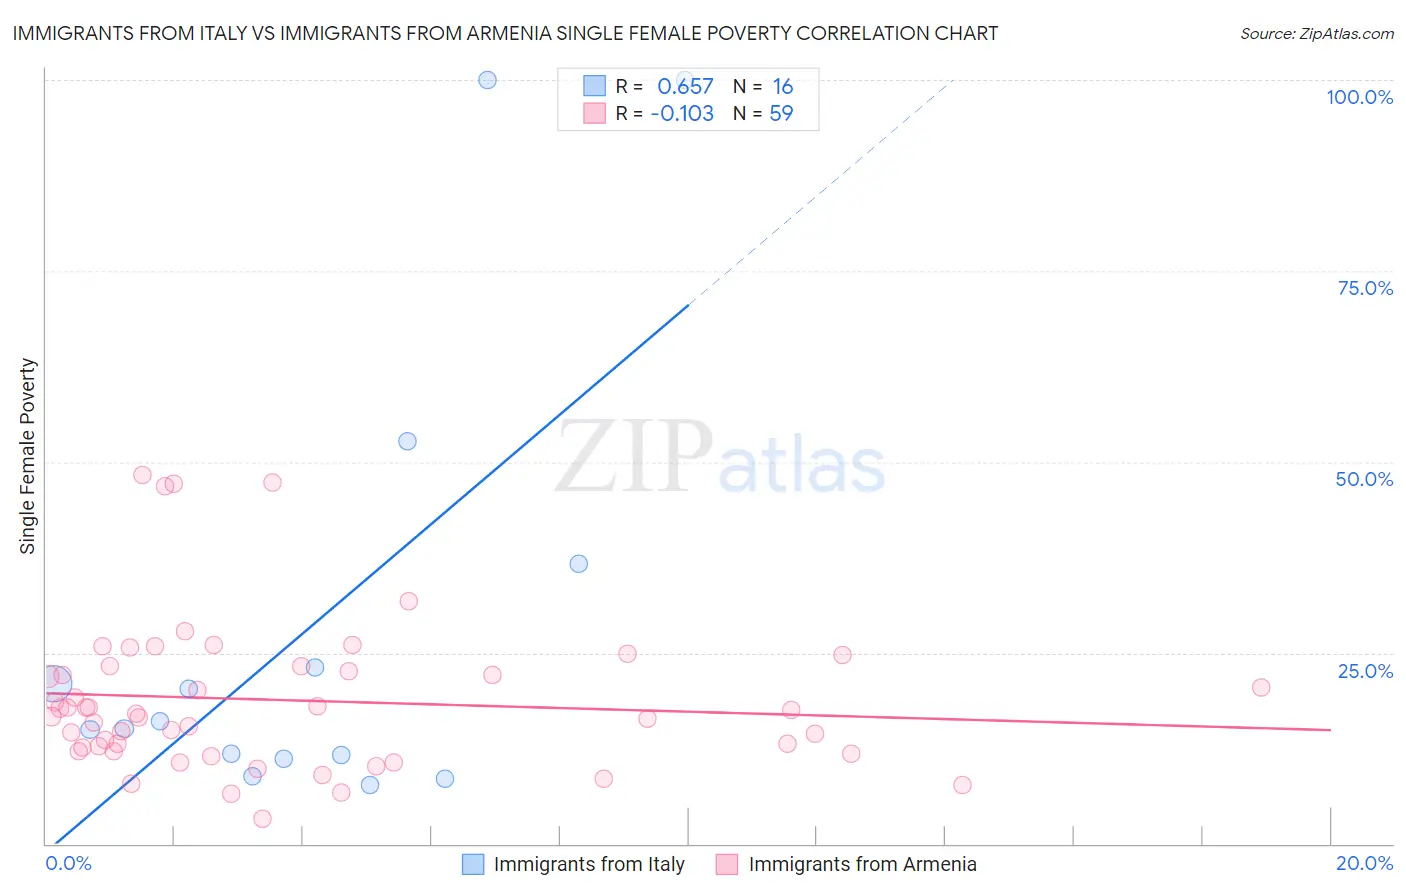
Immigrants from Italy vs Immigrants from Armenia Single Female Poverty Correlation Chart
The statistical analysis conducted on geographies consisting of 318,580,979 people shows a significant positive correlation between the proportion of Immigrants from Italy and poverty level among single females in the United States with a correlation coefficient (R) of 0.657 and weighted average of 19.0%. Similarly, the statistical analysis conducted on geographies consisting of 97,216,113 people shows a poor negative correlation between the proportion of Immigrants from Armenia and poverty level among single females in the United States with a correlation coefficient (R) of -0.103 and weighted average of 18.7%, a difference of 2.1%.
Single Female Poverty Correlation Summary
| Measurement | Immigrants from Italy | Immigrants from Armenia |
| Minimum | 7.7% | 3.3% |
| Maximum | 100.0% | 48.3% |
| Range | 92.3% | 45.0% |
| Mean | 28.7% | 18.8% |
| Median | 15.6% | 16.9% |
| Interquartile 25% (IQ1) | 11.4% | 12.1% |
| Interquartile 75% (IQ3) | 29.9% | 23.2% |
| Interquartile Range (IQR) | 18.5% | 11.0% |
| Standard Deviation (Sample) | 30.1% | 9.9% |
| Standard Deviation (Population) | 29.2% | 9.8% |
Demographics Similar to Immigrants from Italy and Immigrants from Armenia by Single Female Poverty
In terms of single female poverty, the demographic groups most similar to Immigrants from Italy are Immigrants from Eastern Europe (19.0%, a difference of 0.040%), Egyptian (19.1%, a difference of 0.040%), Immigrants from Czechoslovakia (19.0%, a difference of 0.080%), Immigrants from Argentina (19.0%, a difference of 0.090%), and Tsimshian (19.1%, a difference of 0.25%). Similarly, the demographic groups most similar to Immigrants from Armenia are Turkish (18.7%, a difference of 0.020%), Immigrants from Japan (18.6%, a difference of 0.20%), Korean (18.6%, a difference of 0.26%), Tongan (18.8%, a difference of 0.66%), and Bulgarian (18.8%, a difference of 0.69%).
| Demographics | Rating | Rank | Single Female Poverty |
| Koreans | 99.9 /100 | #34 | Exceptional 18.6% |
| Immigrants | Japan | 99.9 /100 | #35 | Exceptional 18.6% |
| Turks | 99.9 /100 | #36 | Exceptional 18.7% |
| Immigrants | Armenia | 99.9 /100 | #37 | Exceptional 18.7% |
| Tongans | 99.9 /100 | #38 | Exceptional 18.8% |
| Bulgarians | 99.9 /100 | #39 | Exceptional 18.8% |
| Okinawans | 99.9 /100 | #40 | Exceptional 18.8% |
| Immigrants | Serbia | 99.9 /100 | #41 | Exceptional 18.8% |
| Jordanians | 99.9 /100 | #42 | Exceptional 18.8% |
| Immigrants | Romania | 99.9 /100 | #43 | Exceptional 18.8% |
| Immigrants | Croatia | 99.9 /100 | #44 | Exceptional 18.9% |
| Immigrants | Indonesia | 99.8 /100 | #45 | Exceptional 18.9% |
| Macedonians | 99.8 /100 | #46 | Exceptional 18.9% |
| Latvians | 99.8 /100 | #47 | Exceptional 19.0% |
| Immigrants | Argentina | 99.8 /100 | #48 | Exceptional 19.0% |
| Immigrants | Czechoslovakia | 99.8 /100 | #49 | Exceptional 19.0% |
| Immigrants | Eastern Europe | 99.8 /100 | #50 | Exceptional 19.0% |
| Immigrants | Italy | 99.8 /100 | #51 | Exceptional 19.0% |
| Egyptians | 99.7 /100 | #52 | Exceptional 19.1% |
| Tsimshian | 99.7 /100 | #53 | Exceptional 19.1% |
| Argentineans | 99.7 /100 | #54 | Exceptional 19.1% |