Hungarian vs Latvian Married-couple Households
COMPARE
Hungarian
Latvian
Married-couple Households
Married-couple Households Comparison
Hungarians
Latvians
49.1%
MARRIED-COUPLE HOUSEHOLDS
99.8/ 100
METRIC RATING
32nd/ 347
METRIC RANK
47.9%
MARRIED-COUPLE HOUSEHOLDS
96.5/ 100
METRIC RATING
97th/ 347
METRIC RANK
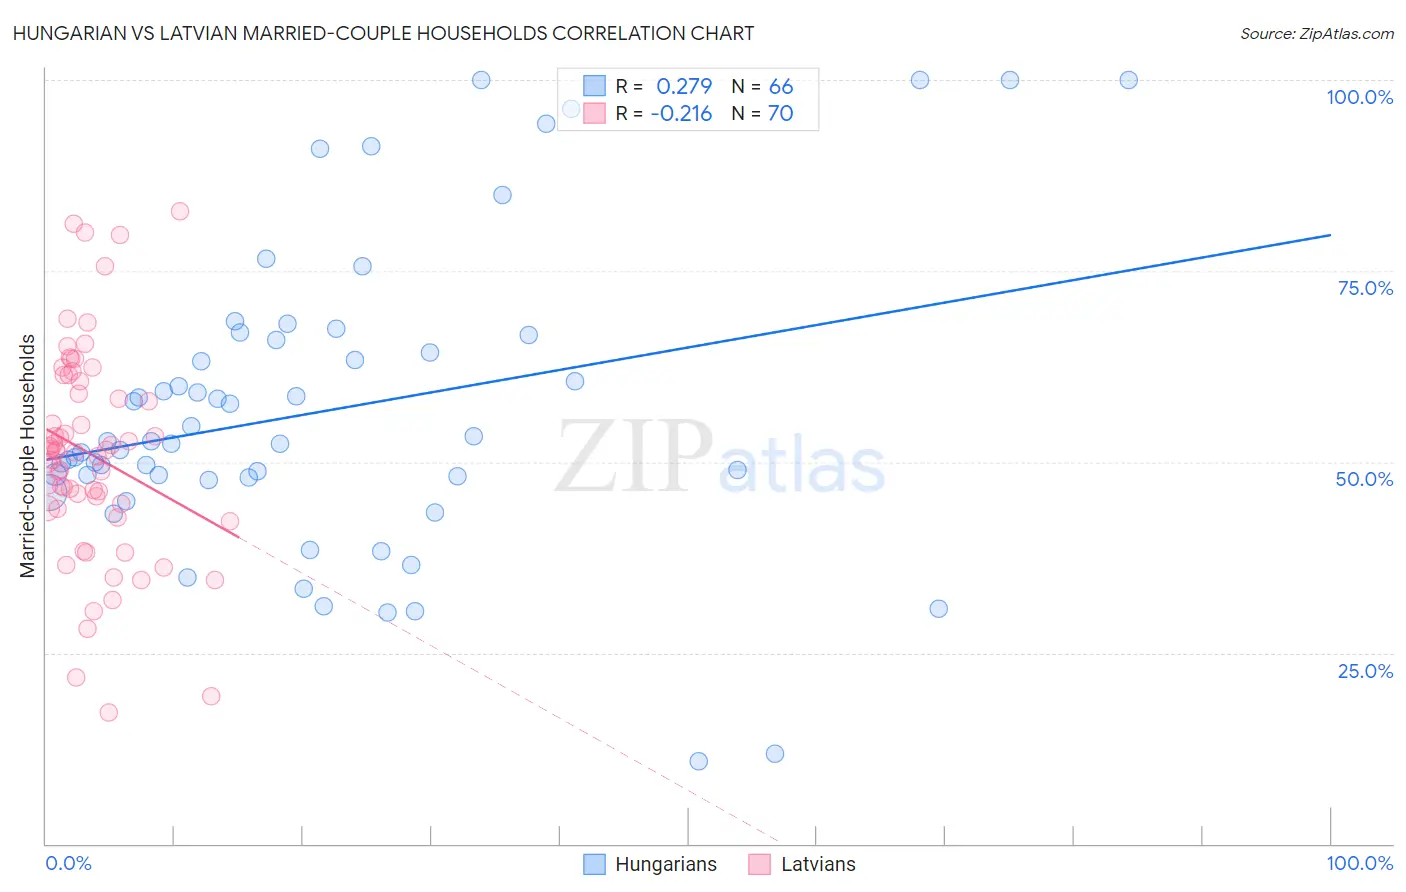
Hungarian vs Latvian Married-couple Households Correlation Chart
The statistical analysis conducted on geographies consisting of 485,875,006 people shows a weak positive correlation between the proportion of Hungarians and percentage of married-couple family households in the United States with a correlation coefficient (R) of 0.279 and weighted average of 49.1%. Similarly, the statistical analysis conducted on geographies consisting of 220,654,230 people shows a weak negative correlation between the proportion of Latvians and percentage of married-couple family households in the United States with a correlation coefficient (R) of -0.216 and weighted average of 47.9%, a difference of 2.5%.
Married-couple Households Correlation Summary
| Measurement | Hungarian | Latvian |
| Minimum | 10.9% | 17.2% |
| Maximum | 100.0% | 82.8% |
| Range | 89.1% | 65.5% |
| Mean | 56.7% | 51.0% |
| Median | 52.5% | 51.4% |
| Interquartile 25% (IQ1) | 47.9% | 43.9% |
| Interquartile 75% (IQ3) | 65.9% | 60.6% |
| Interquartile Range (IQR) | 18.0% | 16.7% |
| Standard Deviation (Sample) | 19.9% | 13.8% |
| Standard Deviation (Population) | 19.8% | 13.7% |
Similar Demographics by Married-couple Households
Demographics Similar to Hungarians by Married-couple Households
In terms of married-couple households, the demographic groups most similar to Hungarians are Immigrants from Asia (49.1%, a difference of 0.030%), Native Hawaiian (49.1%, a difference of 0.060%), Italian (49.0%, a difference of 0.11%), Scottish (49.0%, a difference of 0.13%), and Bolivian (49.2%, a difference of 0.17%).
| Demographics | Rating | Rank | Married-couple Households |
| Immigrants | Philippines | 99.9 /100 | #25 | Exceptional 49.3% |
| Immigrants | Scotland | 99.8 /100 | #26 | Exceptional 49.3% |
| Bhutanese | 99.8 /100 | #27 | Exceptional 49.3% |
| Germans | 99.8 /100 | #28 | Exceptional 49.2% |
| Maltese | 99.8 /100 | #29 | Exceptional 49.2% |
| Bolivians | 99.8 /100 | #30 | Exceptional 49.2% |
| Native Hawaiians | 99.8 /100 | #31 | Exceptional 49.1% |
| Hungarians | 99.8 /100 | #32 | Exceptional 49.1% |
| Immigrants | Asia | 99.7 /100 | #33 | Exceptional 49.1% |
| Italians | 99.7 /100 | #34 | Exceptional 49.0% |
| Scottish | 99.7 /100 | #35 | Exceptional 49.0% |
| Iranians | 99.7 /100 | #36 | Exceptional 49.0% |
| Sri Lankans | 99.7 /100 | #37 | Exceptional 49.0% |
| Greeks | 99.7 /100 | #38 | Exceptional 48.9% |
| Lithuanians | 99.6 /100 | #39 | Exceptional 48.9% |
Demographics Similar to Latvians by Married-couple Households
In terms of married-couple households, the demographic groups most similar to Latvians are Immigrants from North Macedonia (47.9%, a difference of 0.010%), Immigrants from Austria (47.9%, a difference of 0.020%), Immigrants from Egypt (47.9%, a difference of 0.030%), Immigrants from Italy (47.9%, a difference of 0.030%), and Immigrants from Belgium (47.9%, a difference of 0.080%).
| Demographics | Rating | Rank | Married-couple Households |
| French | 97.2 /100 | #90 | Exceptional 48.0% |
| Immigrants | Moldova | 97.0 /100 | #91 | Exceptional 48.0% |
| Palestinians | 96.9 /100 | #92 | Exceptional 48.0% |
| Lebanese | 96.9 /100 | #93 | Exceptional 47.9% |
| Americans | 96.9 /100 | #94 | Exceptional 47.9% |
| Immigrants | Belgium | 96.8 /100 | #95 | Exceptional 47.9% |
| Immigrants | Egypt | 96.6 /100 | #96 | Exceptional 47.9% |
| Latvians | 96.5 /100 | #97 | Exceptional 47.9% |
| Immigrants | North Macedonia | 96.4 /100 | #98 | Exceptional 47.9% |
| Immigrants | Austria | 96.4 /100 | #99 | Exceptional 47.9% |
| Immigrants | Italy | 96.3 /100 | #100 | Exceptional 47.9% |
| Turks | 96.1 /100 | #101 | Exceptional 47.8% |
| Slavs | 96.0 /100 | #102 | Exceptional 47.8% |
| Hawaiians | 96.0 /100 | #103 | Exceptional 47.8% |
| Immigrants | South Africa | 96.0 /100 | #104 | Exceptional 47.8% |