Houma vs Immigrants from China High School Diploma
COMPARE
Houma
Immigrants from China
High School Diploma
High School Diploma Comparison
Houma
Immigrants from China
81.5%
HIGH SCHOOL DIPLOMA
0.0/ 100
METRIC RATING
340th/ 347
METRIC RANK
89.3%
HIGH SCHOOL DIPLOMA
62.0/ 100
METRIC RATING
159th/ 347
METRIC RANK
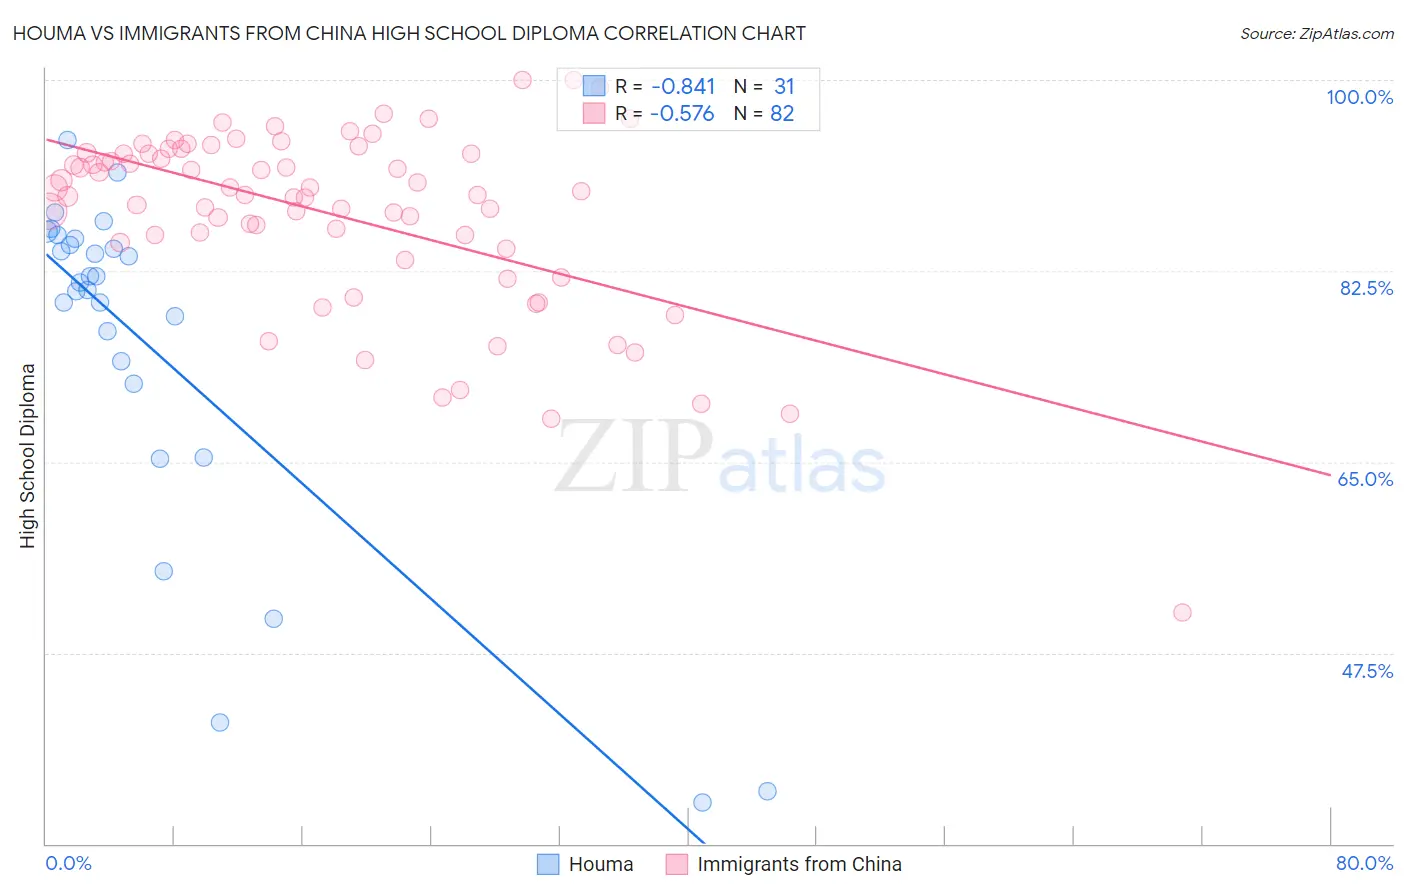
Houma vs Immigrants from China High School Diploma Correlation Chart
The statistical analysis conducted on geographies consisting of 36,795,916 people shows a very strong negative correlation between the proportion of Houma and percentage of population with at least high school diploma education in the United States with a correlation coefficient (R) of -0.841 and weighted average of 81.5%. Similarly, the statistical analysis conducted on geographies consisting of 457,082,738 people shows a substantial negative correlation between the proportion of Immigrants from China and percentage of population with at least high school diploma education in the United States with a correlation coefficient (R) of -0.576 and weighted average of 89.3%, a difference of 9.5%.
High School Diploma Correlation Summary
| Measurement | Houma | Immigrants from China |
| Minimum | 33.8% | 51.2% |
| Maximum | 94.5% | 100.0% |
| Range | 60.8% | 48.8% |
| Mean | 75.5% | 87.6% |
| Median | 81.4% | 89.6% |
| Interquartile 25% (IQ1) | 72.2% | 85.1% |
| Interquartile 75% (IQ3) | 85.4% | 93.3% |
| Interquartile Range (IQR) | 13.2% | 8.2% |
| Standard Deviation (Sample) | 16.1% | 8.5% |
| Standard Deviation (Population) | 15.9% | 8.4% |
Similar Demographics by High School Diploma
Demographics Similar to Houma by High School Diploma
In terms of high school diploma, the demographic groups most similar to Houma are Pima (81.6%, a difference of 0.11%), Mexican (81.4%, a difference of 0.15%), Salvadoran (81.7%, a difference of 0.20%), Immigrants from Guatemala (81.4%, a difference of 0.20%), and Immigrants from Yemen (81.8%, a difference of 0.38%).
| Demographics | Rating | Rank | High School Diploma |
| Immigrants | Latin America | 0.0 /100 | #333 | Tragic 82.1% |
| Tohono O'odham | 0.0 /100 | #334 | Tragic 82.1% |
| Guatemalans | 0.0 /100 | #335 | Tragic 82.0% |
| Immigrants | Dominican Republic | 0.0 /100 | #336 | Tragic 82.0% |
| Immigrants | Yemen | 0.0 /100 | #337 | Tragic 81.8% |
| Salvadorans | 0.0 /100 | #338 | Tragic 81.7% |
| Pima | 0.0 /100 | #339 | Tragic 81.6% |
| Houma | 0.0 /100 | #340 | Tragic 81.5% |
| Mexicans | 0.0 /100 | #341 | Tragic 81.4% |
| Immigrants | Guatemala | 0.0 /100 | #342 | Tragic 81.4% |
| Immigrants | El Salvador | 0.0 /100 | #343 | Tragic 80.8% |
| Immigrants | Central America | 0.0 /100 | #344 | Tragic 80.1% |
| Yakama | 0.0 /100 | #345 | Tragic 80.0% |
| Spanish American Indians | 0.0 /100 | #346 | Tragic 79.8% |
| Immigrants | Mexico | 0.0 /100 | #347 | Tragic 79.5% |
Demographics Similar to Immigrants from China by High School Diploma
In terms of high school diploma, the demographic groups most similar to Immigrants from China are Laotian (89.3%, a difference of 0.0%), Immigrants from Pakistan (89.3%, a difference of 0.010%), Brazilian (89.3%, a difference of 0.010%), Bermudan (89.3%, a difference of 0.010%), and Cree (89.3%, a difference of 0.010%).
| Demographics | Rating | Rank | High School Diploma |
| Asians | 70.7 /100 | #152 | Good 89.4% |
| Immigrants | Iraq | 68.7 /100 | #153 | Good 89.4% |
| Alsatians | 66.8 /100 | #154 | Good 89.4% |
| Immigrants | Northern Africa | 66.4 /100 | #155 | Good 89.4% |
| Immigrants | Argentina | 65.5 /100 | #156 | Good 89.4% |
| Immigrants | Malaysia | 63.5 /100 | #157 | Good 89.3% |
| Immigrants | Pakistan | 62.5 /100 | #158 | Good 89.3% |
| Immigrants | China | 62.0 /100 | #159 | Good 89.3% |
| Laotians | 61.8 /100 | #160 | Good 89.3% |
| Brazilians | 61.2 /100 | #161 | Good 89.3% |
| Bermudans | 61.1 /100 | #162 | Good 89.3% |
| Cree | 61.1 /100 | #163 | Good 89.3% |
| Immigrants | Nepal | 61.1 /100 | #164 | Good 89.3% |
| Immigrants | Asia | 59.8 /100 | #165 | Average 89.3% |
| Immigrants | Albania | 59.4 /100 | #166 | Average 89.3% |