Immigrants from Laos vs Czech Single Mother Poverty
COMPARE
Immigrants from Laos
Czech
Single Mother Poverty
Single Mother Poverty Comparison
Immigrants from Laos
Czechs
30.6%
SINGLE MOTHER POVERTY
1.8/ 100
METRIC RATING
241st/ 347
METRIC RANK
28.9%
SINGLE MOTHER POVERTY
68.4/ 100
METRIC RATING
159th/ 347
METRIC RANK
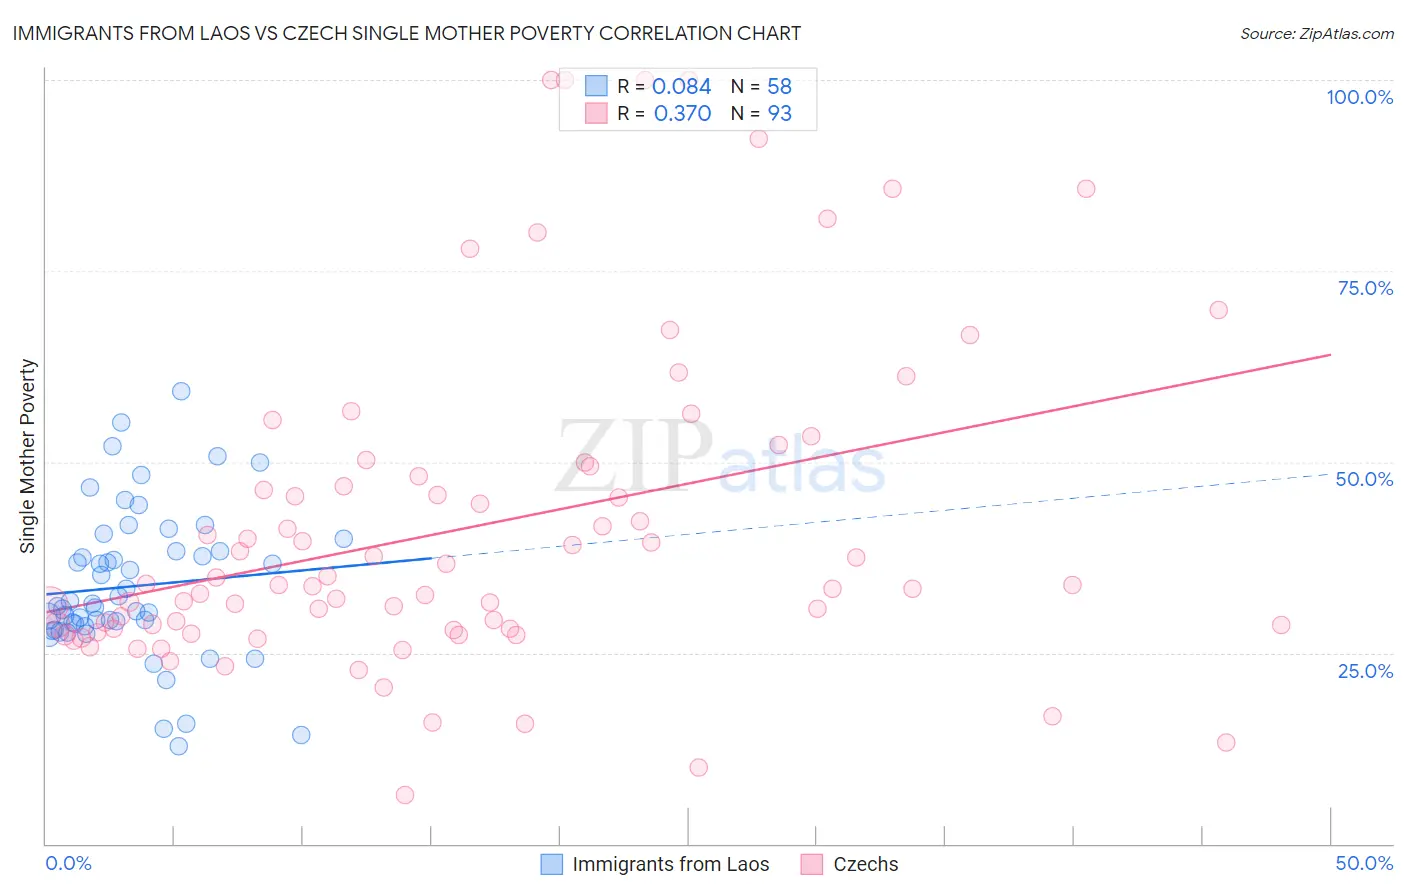
Immigrants from Laos vs Czech Single Mother Poverty Correlation Chart
The statistical analysis conducted on geographies consisting of 199,327,498 people shows a slight positive correlation between the proportion of Immigrants from Laos and poverty level among single mothers in the United States with a correlation coefficient (R) of 0.084 and weighted average of 30.6%. Similarly, the statistical analysis conducted on geographies consisting of 466,588,307 people shows a mild positive correlation between the proportion of Czechs and poverty level among single mothers in the United States with a correlation coefficient (R) of 0.370 and weighted average of 28.9%, a difference of 5.8%.
Single Mother Poverty Correlation Summary
| Measurement | Immigrants from Laos | Czech |
| Minimum | 12.7% | 6.4% |
| Maximum | 59.2% | 100.0% |
| Range | 46.5% | 93.6% |
| Mean | 33.7% | 41.3% |
| Median | 31.3% | 33.8% |
| Interquartile 25% (IQ1) | 28.5% | 28.1% |
| Interquartile 75% (IQ3) | 38.3% | 48.7% |
| Interquartile Range (IQR) | 9.9% | 20.7% |
| Standard Deviation (Sample) | 9.8% | 21.1% |
| Standard Deviation (Population) | 9.7% | 21.0% |
Similar Demographics by Single Mother Poverty
Demographics Similar to Immigrants from Laos by Single Mother Poverty
In terms of single mother poverty, the demographic groups most similar to Immigrants from Laos are Immigrants from Burma/Myanmar (30.6%, a difference of 0.020%), Salvadoran (30.6%, a difference of 0.050%), Bermudan (30.6%, a difference of 0.10%), Immigrants from Portugal (30.5%, a difference of 0.18%), and French (30.7%, a difference of 0.32%).
| Demographics | Rating | Rank | Single Mother Poverty |
| Immigrants | Nicaragua | 3.5 /100 | #234 | Tragic 30.3% |
| Immigrants | Grenada | 3.4 /100 | #235 | Tragic 30.3% |
| Welsh | 3.2 /100 | #236 | Tragic 30.4% |
| Immigrants | St. Vincent and the Grenadines | 3.1 /100 | #237 | Tragic 30.4% |
| Slovaks | 2.8 /100 | #238 | Tragic 30.4% |
| Immigrants | Portugal | 2.1 /100 | #239 | Tragic 30.5% |
| Salvadorans | 1.8 /100 | #240 | Tragic 30.6% |
| Immigrants | Laos | 1.8 /100 | #241 | Tragic 30.6% |
| Immigrants | Burma/Myanmar | 1.7 /100 | #242 | Tragic 30.6% |
| Bermudans | 1.6 /100 | #243 | Tragic 30.6% |
| French | 1.3 /100 | #244 | Tragic 30.7% |
| Barbadians | 1.3 /100 | #245 | Tragic 30.7% |
| Ecuadorians | 0.9 /100 | #246 | Tragic 30.8% |
| West Indians | 0.9 /100 | #247 | Tragic 30.8% |
| French Canadians | 0.9 /100 | #248 | Tragic 30.8% |
Demographics Similar to Czechs by Single Mother Poverty
In terms of single mother poverty, the demographic groups most similar to Czechs are Japanese (28.9%, a difference of 0.020%), Immigrants from Cambodia (28.9%, a difference of 0.10%), Immigrants from Hungary (28.9%, a difference of 0.12%), Scandinavian (28.9%, a difference of 0.12%), and Immigrants from Nigeria (28.9%, a difference of 0.14%).
| Demographics | Rating | Rank | Single Mother Poverty |
| Austrians | 79.0 /100 | #152 | Good 28.7% |
| Slovenes | 76.4 /100 | #153 | Good 28.8% |
| Portuguese | 73.2 /100 | #154 | Good 28.8% |
| Ugandans | 71.7 /100 | #155 | Good 28.8% |
| Iraqis | 71.5 /100 | #156 | Good 28.8% |
| Immigrants | Western Europe | 71.1 /100 | #157 | Good 28.9% |
| Immigrants | Hungary | 70.6 /100 | #158 | Good 28.9% |
| Czechs | 68.4 /100 | #159 | Good 28.9% |
| Japanese | 68.0 /100 | #160 | Good 28.9% |
| Immigrants | Cambodia | 66.6 /100 | #161 | Good 28.9% |
| Scandinavians | 66.2 /100 | #162 | Good 28.9% |
| Immigrants | Nigeria | 65.9 /100 | #163 | Good 28.9% |
| Immigrants | Kenya | 65.9 /100 | #164 | Good 28.9% |
| Arabs | 60.7 /100 | #165 | Good 29.0% |
| Inupiat | 60.4 /100 | #166 | Good 29.0% |