Immigrants from Sri Lanka vs Bermudan Single Mother Poverty
COMPARE
Immigrants from Sri Lanka
Bermudan
Single Mother Poverty
Single Mother Poverty Comparison
Immigrants from Sri Lanka
Bermudans
26.3%
SINGLE MOTHER POVERTY
100.0/ 100
METRIC RATING
26th/ 347
METRIC RANK
30.6%
SINGLE MOTHER POVERTY
1.6/ 100
METRIC RATING
243rd/ 347
METRIC RANK
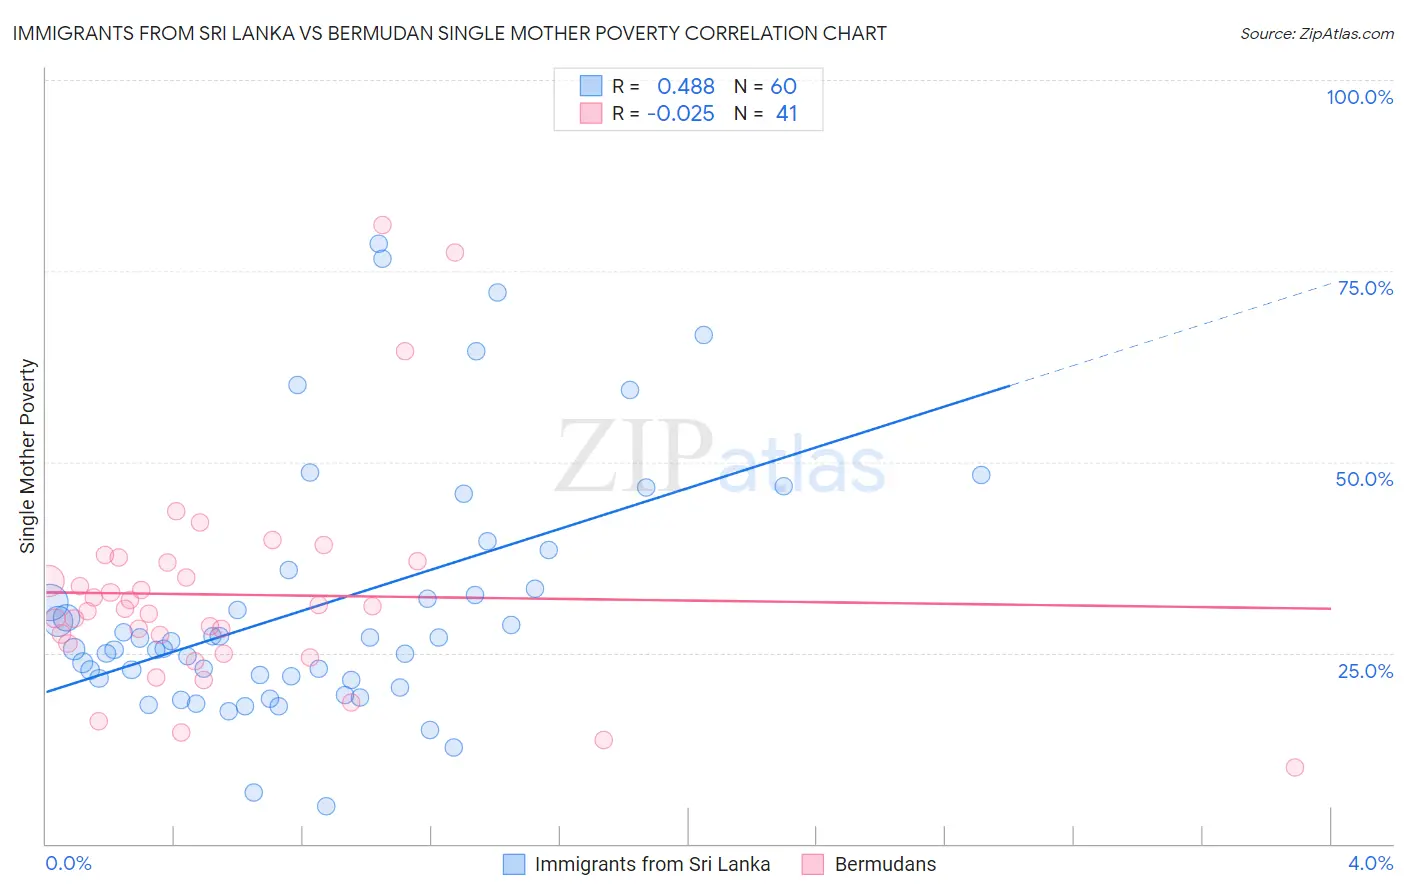
Immigrants from Sri Lanka vs Bermudan Single Mother Poverty Correlation Chart
The statistical analysis conducted on geographies consisting of 147,892,421 people shows a moderate positive correlation between the proportion of Immigrants from Sri Lanka and poverty level among single mothers in the United States with a correlation coefficient (R) of 0.488 and weighted average of 26.3%. Similarly, the statistical analysis conducted on geographies consisting of 55,530,173 people shows no correlation between the proportion of Bermudans and poverty level among single mothers in the United States with a correlation coefficient (R) of -0.025 and weighted average of 30.6%, a difference of 16.2%.
Single Mother Poverty Correlation Summary
| Measurement | Immigrants from Sri Lanka | Bermudan |
| Minimum | 4.9% | 10.0% |
| Maximum | 78.5% | 81.0% |
| Range | 73.6% | 71.0% |
| Mean | 31.2% | 32.6% |
| Median | 26.0% | 30.7% |
| Interquartile 25% (IQ1) | 21.6% | 25.5% |
| Interquartile 75% (IQ3) | 34.6% | 36.9% |
| Interquartile Range (IQR) | 13.0% | 11.3% |
| Standard Deviation (Sample) | 16.5% | 14.2% |
| Standard Deviation (Population) | 16.3% | 14.0% |
Similar Demographics by Single Mother Poverty
Demographics Similar to Immigrants from Sri Lanka by Single Mother Poverty
In terms of single mother poverty, the demographic groups most similar to Immigrants from Sri Lanka are Immigrants from Asia (26.3%, a difference of 0.13%), Immigrants from Japan (26.4%, a difference of 0.22%), Korean (26.4%, a difference of 0.24%), Jordanian (26.4%, a difference of 0.29%), and Immigrants from Moldova (26.2%, a difference of 0.32%).
| Demographics | Rating | Rank | Single Mother Poverty |
| Immigrants | Eastern Asia | 100.0 /100 | #19 | Exceptional 26.1% |
| Immigrants | China | 100.0 /100 | #20 | Exceptional 26.1% |
| Immigrants | Bolivia | 100.0 /100 | #21 | Exceptional 26.2% |
| Immigrants | Korea | 100.0 /100 | #22 | Exceptional 26.2% |
| Burmese | 100.0 /100 | #23 | Exceptional 26.2% |
| Immigrants | Moldova | 100.0 /100 | #24 | Exceptional 26.2% |
| Immigrants | Asia | 100.0 /100 | #25 | Exceptional 26.3% |
| Immigrants | Sri Lanka | 100.0 /100 | #26 | Exceptional 26.3% |
| Immigrants | Japan | 100.0 /100 | #27 | Exceptional 26.4% |
| Koreans | 100.0 /100 | #28 | Exceptional 26.4% |
| Jordanians | 100.0 /100 | #29 | Exceptional 26.4% |
| Turks | 100.0 /100 | #30 | Exceptional 26.4% |
| Immigrants | Philippines | 100.0 /100 | #31 | Exceptional 26.5% |
| Tongans | 99.9 /100 | #32 | Exceptional 26.5% |
| Bulgarians | 99.9 /100 | #33 | Exceptional 26.5% |
Demographics Similar to Bermudans by Single Mother Poverty
In terms of single mother poverty, the demographic groups most similar to Bermudans are Immigrants from Burma/Myanmar (30.6%, a difference of 0.080%), Immigrants from Laos (30.6%, a difference of 0.10%), Salvadoran (30.6%, a difference of 0.15%), French (30.7%, a difference of 0.22%), and Barbadian (30.7%, a difference of 0.23%).
| Demographics | Rating | Rank | Single Mother Poverty |
| Welsh | 3.2 /100 | #236 | Tragic 30.4% |
| Immigrants | St. Vincent and the Grenadines | 3.1 /100 | #237 | Tragic 30.4% |
| Slovaks | 2.8 /100 | #238 | Tragic 30.4% |
| Immigrants | Portugal | 2.1 /100 | #239 | Tragic 30.5% |
| Salvadorans | 1.8 /100 | #240 | Tragic 30.6% |
| Immigrants | Laos | 1.8 /100 | #241 | Tragic 30.6% |
| Immigrants | Burma/Myanmar | 1.7 /100 | #242 | Tragic 30.6% |
| Bermudans | 1.6 /100 | #243 | Tragic 30.6% |
| French | 1.3 /100 | #244 | Tragic 30.7% |
| Barbadians | 1.3 /100 | #245 | Tragic 30.7% |
| Ecuadorians | 0.9 /100 | #246 | Tragic 30.8% |
| West Indians | 0.9 /100 | #247 | Tragic 30.8% |
| French Canadians | 0.9 /100 | #248 | Tragic 30.8% |
| Cape Verdeans | 0.8 /100 | #249 | Tragic 30.8% |
| Vietnamese | 0.7 /100 | #250 | Tragic 30.9% |