Immigrants from Zaire vs Bermudan Single Mother Poverty
COMPARE
Immigrants from Zaire
Bermudan
Single Mother Poverty
Single Mother Poverty Comparison
Immigrants from Zaire
Bermudans
32.0%
SINGLE MOTHER POVERTY
0.0/ 100
METRIC RATING
278th/ 347
METRIC RANK
30.6%
SINGLE MOTHER POVERTY
1.6/ 100
METRIC RATING
243rd/ 347
METRIC RANK
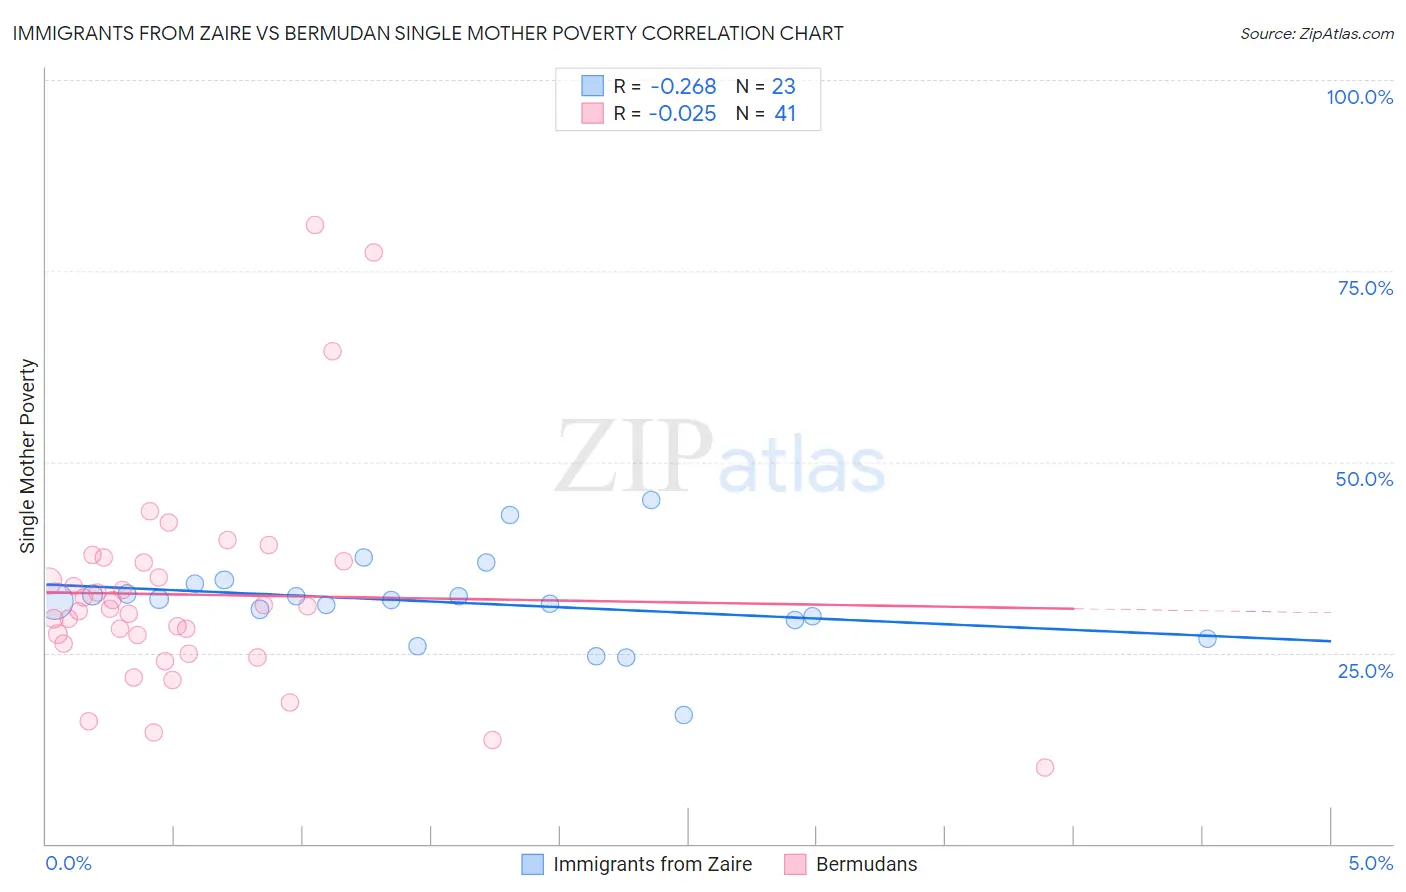
Immigrants from Zaire vs Bermudan Single Mother Poverty Correlation Chart
The statistical analysis conducted on geographies consisting of 106,703,532 people shows a weak negative correlation between the proportion of Immigrants from Zaire and poverty level among single mothers in the United States with a correlation coefficient (R) of -0.268 and weighted average of 32.0%. Similarly, the statistical analysis conducted on geographies consisting of 55,530,173 people shows no correlation between the proportion of Bermudans and poverty level among single mothers in the United States with a correlation coefficient (R) of -0.025 and weighted average of 30.6%, a difference of 4.5%.
Single Mother Poverty Correlation Summary
| Measurement | Immigrants from Zaire | Bermudan |
| Minimum | 16.9% | 10.0% |
| Maximum | 45.1% | 81.0% |
| Range | 28.2% | 71.0% |
| Mean | 31.6% | 32.6% |
| Median | 31.9% | 30.7% |
| Interquartile 25% (IQ1) | 29.4% | 25.5% |
| Interquartile 75% (IQ3) | 34.1% | 36.9% |
| Interquartile Range (IQR) | 4.7% | 11.3% |
| Standard Deviation (Sample) | 5.9% | 14.2% |
| Standard Deviation (Population) | 5.8% | 14.0% |
Similar Demographics by Single Mother Poverty
Demographics Similar to Immigrants from Zaire by Single Mother Poverty
In terms of single mother poverty, the demographic groups most similar to Immigrants from Zaire are Mexican American Indian (31.9%, a difference of 0.22%), Marshallese (32.1%, a difference of 0.40%), Delaware (31.8%, a difference of 0.43%), Central American (31.8%, a difference of 0.60%), and Nonimmigrants (32.2%, a difference of 0.62%).
| Demographics | Rating | Rank | Single Mother Poverty |
| Immigrants | Cabo Verde | 0.1 /100 | #271 | Tragic 31.6% |
| Immigrants | Micronesia | 0.1 /100 | #272 | Tragic 31.6% |
| Fijians | 0.1 /100 | #273 | Tragic 31.6% |
| Bangladeshis | 0.1 /100 | #274 | Tragic 31.7% |
| Central Americans | 0.1 /100 | #275 | Tragic 31.8% |
| Delaware | 0.0 /100 | #276 | Tragic 31.8% |
| Mexican American Indians | 0.0 /100 | #277 | Tragic 31.9% |
| Immigrants | Zaire | 0.0 /100 | #278 | Tragic 32.0% |
| Marshallese | 0.0 /100 | #279 | Tragic 32.1% |
| Immigrants | Nonimmigrants | 0.0 /100 | #280 | Tragic 32.2% |
| Cree | 0.0 /100 | #281 | Tragic 32.2% |
| Immigrants | Azores | 0.0 /100 | #282 | Tragic 32.2% |
| Spanish Americans | 0.0 /100 | #283 | Tragic 32.3% |
| Indonesians | 0.0 /100 | #284 | Tragic 32.4% |
| Immigrants | Latin America | 0.0 /100 | #285 | Tragic 32.4% |
Demographics Similar to Bermudans by Single Mother Poverty
In terms of single mother poverty, the demographic groups most similar to Bermudans are Immigrants from Burma/Myanmar (30.6%, a difference of 0.080%), Immigrants from Laos (30.6%, a difference of 0.10%), Salvadoran (30.6%, a difference of 0.15%), French (30.7%, a difference of 0.22%), and Barbadian (30.7%, a difference of 0.23%).
| Demographics | Rating | Rank | Single Mother Poverty |
| Welsh | 3.2 /100 | #236 | Tragic 30.4% |
| Immigrants | St. Vincent and the Grenadines | 3.1 /100 | #237 | Tragic 30.4% |
| Slovaks | 2.8 /100 | #238 | Tragic 30.4% |
| Immigrants | Portugal | 2.1 /100 | #239 | Tragic 30.5% |
| Salvadorans | 1.8 /100 | #240 | Tragic 30.6% |
| Immigrants | Laos | 1.8 /100 | #241 | Tragic 30.6% |
| Immigrants | Burma/Myanmar | 1.7 /100 | #242 | Tragic 30.6% |
| Bermudans | 1.6 /100 | #243 | Tragic 30.6% |
| French | 1.3 /100 | #244 | Tragic 30.7% |
| Barbadians | 1.3 /100 | #245 | Tragic 30.7% |
| Ecuadorians | 0.9 /100 | #246 | Tragic 30.8% |
| West Indians | 0.9 /100 | #247 | Tragic 30.8% |
| French Canadians | 0.9 /100 | #248 | Tragic 30.8% |
| Cape Verdeans | 0.8 /100 | #249 | Tragic 30.8% |
| Vietnamese | 0.7 /100 | #250 | Tragic 30.9% |