Ethiopian vs Yuman Poverty
COMPARE
Ethiopian
Yuman
Poverty
Poverty Comparison
Ethiopians
Yuman
12.2%
POVERTY
59.1/ 100
METRIC RATING
162nd/ 347
METRIC RANK
20.2%
POVERTY
0.0/ 100
METRIC RATING
338th/ 347
METRIC RANK
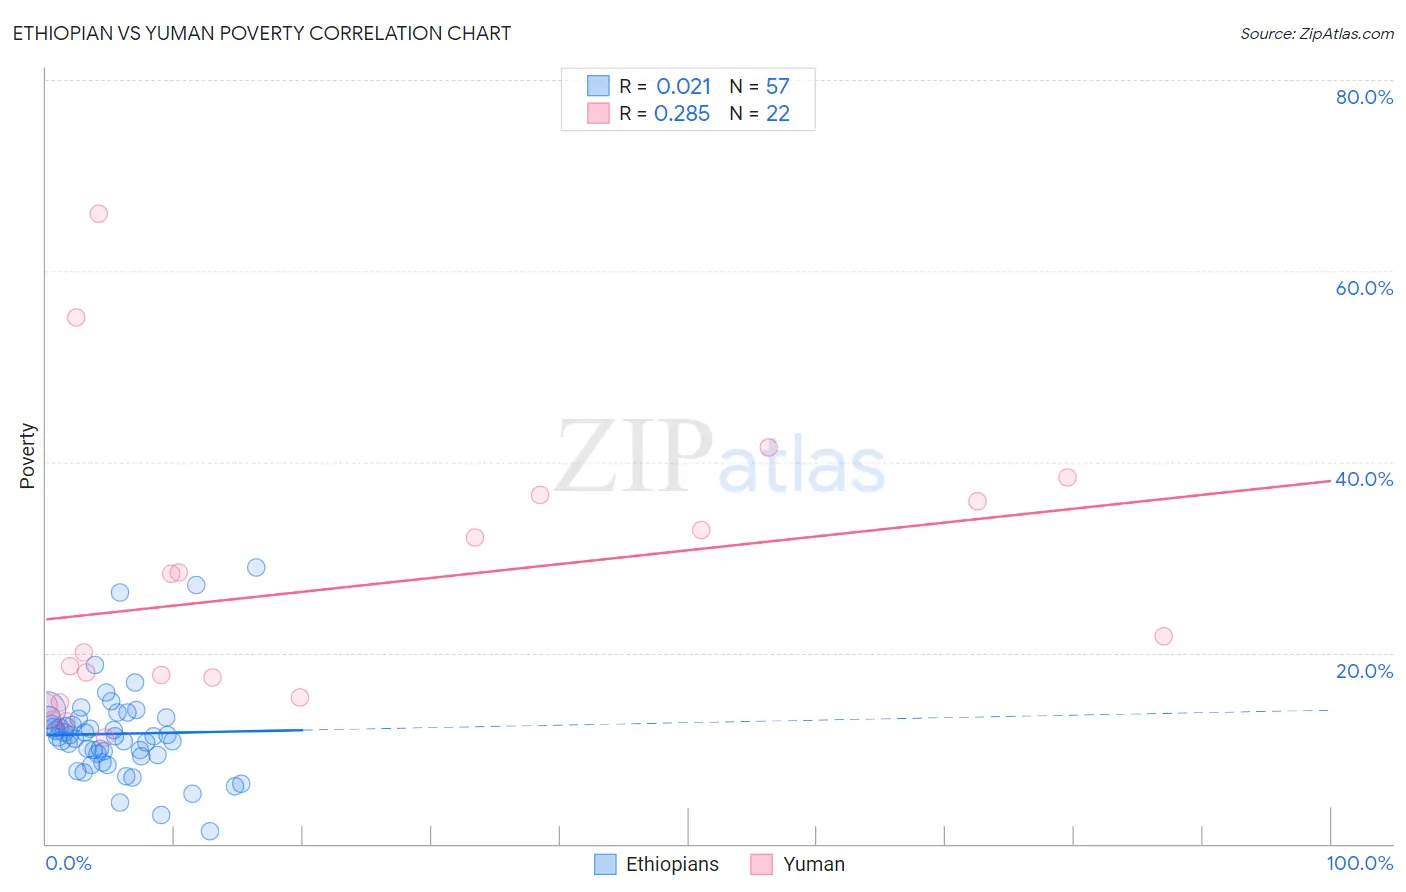
Ethiopian vs Yuman Poverty Correlation Chart
The statistical analysis conducted on geographies consisting of 223,124,419 people shows no correlation between the proportion of Ethiopians and poverty level in the United States with a correlation coefficient (R) of 0.021 and weighted average of 12.2%. Similarly, the statistical analysis conducted on geographies consisting of 40,667,603 people shows a weak positive correlation between the proportion of Yuman and poverty level in the United States with a correlation coefficient (R) of 0.285 and weighted average of 20.2%, a difference of 65.5%.
Poverty Correlation Summary
| Measurement | Ethiopian | Yuman |
| Minimum | 1.3% | 11.1% |
| Maximum | 28.9% | 66.0% |
| Range | 27.7% | 54.9% |
| Mean | 11.5% | 26.8% |
| Median | 11.3% | 20.9% |
| Interquartile 25% (IQ1) | 9.2% | 15.3% |
| Interquartile 75% (IQ3) | 13.1% | 35.8% |
| Interquartile Range (IQR) | 3.9% | 20.5% |
| Standard Deviation (Sample) | 5.0% | 14.4% |
| Standard Deviation (Population) | 4.9% | 14.1% |
Similar Demographics by Poverty
Demographics Similar to Ethiopians by Poverty
In terms of poverty, the demographic groups most similar to Ethiopians are Immigrants from Fiji (12.2%, a difference of 0.010%), Immigrants from Ethiopia (12.2%, a difference of 0.050%), Colombian (12.2%, a difference of 0.12%), Immigrants from Nepal (12.2%, a difference of 0.13%), and Immigrants from Albania (12.2%, a difference of 0.13%).
| Demographics | Rating | Rank | Poverty |
| Hungarians | 63.6 /100 | #155 | Good 12.2% |
| Scotch-Irish | 62.6 /100 | #156 | Good 12.2% |
| Costa Ricans | 62.2 /100 | #157 | Good 12.2% |
| Taiwanese | 61.8 /100 | #158 | Good 12.2% |
| Pennsylvania Germans | 60.8 /100 | #159 | Good 12.2% |
| Immigrants | Nepal | 60.4 /100 | #160 | Good 12.2% |
| Immigrants | Fiji | 59.1 /100 | #161 | Average 12.2% |
| Ethiopians | 59.1 /100 | #162 | Average 12.2% |
| Immigrants | Ethiopia | 58.6 /100 | #163 | Average 12.2% |
| Colombians | 57.8 /100 | #164 | Average 12.2% |
| Immigrants | Albania | 57.7 /100 | #165 | Average 12.2% |
| Venezuelans | 56.9 /100 | #166 | Average 12.2% |
| Immigrants | Chile | 56.7 /100 | #167 | Average 12.2% |
| Immigrants | Venezuela | 56.5 /100 | #168 | Average 12.2% |
| Whites/Caucasians | 55.4 /100 | #169 | Average 12.3% |
Demographics Similar to Yuman by Poverty
In terms of poverty, the demographic groups most similar to Yuman are Sioux (19.8%, a difference of 2.2%), Crow (20.7%, a difference of 2.2%), Yup'ik (20.8%, a difference of 3.0%), Hopi (20.8%, a difference of 3.2%), and Pueblo (19.4%, a difference of 4.1%).
| Demographics | Rating | Rank | Poverty |
| Immigrants | Dominican Republic | 0.0 /100 | #331 | Tragic 17.8% |
| Natives/Alaskans | 0.0 /100 | #332 | Tragic 18.1% |
| Houma | 0.0 /100 | #333 | Tragic 18.4% |
| Apache | 0.0 /100 | #334 | Tragic 18.4% |
| Cheyenne | 0.0 /100 | #335 | Tragic 18.9% |
| Pueblo | 0.0 /100 | #336 | Tragic 19.4% |
| Sioux | 0.0 /100 | #337 | Tragic 19.8% |
| Yuman | 0.0 /100 | #338 | Tragic 20.2% |
| Crow | 0.0 /100 | #339 | Tragic 20.7% |
| Yup'ik | 0.0 /100 | #340 | Tragic 20.8% |
| Hopi | 0.0 /100 | #341 | Tragic 20.8% |
| Immigrants | Yemen | 0.0 /100 | #342 | Tragic 21.5% |
| Pima | 0.0 /100 | #343 | Tragic 21.9% |
| Lumbee | 0.0 /100 | #344 | Tragic 21.9% |
| Navajo | 0.0 /100 | #345 | Tragic 23.1% |