Ethiopian vs Immigrants from Uganda Poverty
COMPARE
Ethiopian
Immigrants from Uganda
Poverty
Poverty Comparison
Ethiopians
Immigrants from Uganda
12.2%
POVERTY
59.1/ 100
METRIC RATING
162nd/ 347
METRIC RANK
12.8%
POVERTY
16.5/ 100
METRIC RATING
201st/ 347
METRIC RANK
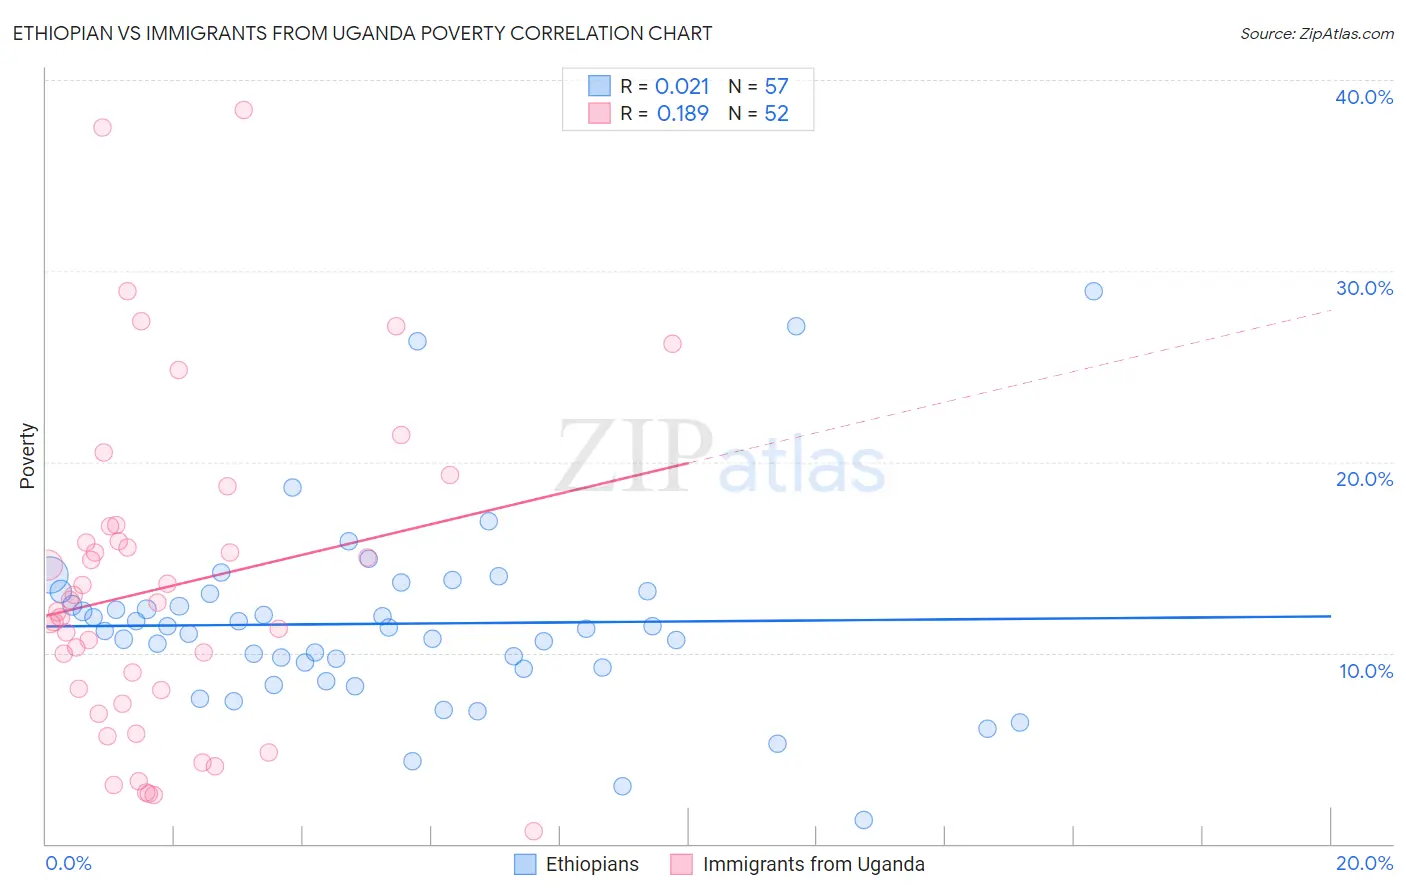
Ethiopian vs Immigrants from Uganda Poverty Correlation Chart
The statistical analysis conducted on geographies consisting of 223,124,419 people shows no correlation between the proportion of Ethiopians and poverty level in the United States with a correlation coefficient (R) of 0.021 and weighted average of 12.2%. Similarly, the statistical analysis conducted on geographies consisting of 125,970,249 people shows a poor positive correlation between the proportion of Immigrants from Uganda and poverty level in the United States with a correlation coefficient (R) of 0.189 and weighted average of 12.8%, a difference of 4.9%.
Poverty Correlation Summary
| Measurement | Ethiopian | Immigrants from Uganda |
| Minimum | 1.3% | 0.63% |
| Maximum | 28.9% | 38.4% |
| Range | 27.7% | 37.8% |
| Mean | 11.5% | 13.5% |
| Median | 11.3% | 12.4% |
| Interquartile 25% (IQ1) | 9.2% | 7.7% |
| Interquartile 75% (IQ3) | 13.1% | 16.2% |
| Interquartile Range (IQR) | 3.9% | 8.6% |
| Standard Deviation (Sample) | 5.0% | 8.5% |
| Standard Deviation (Population) | 4.9% | 8.4% |
Similar Demographics by Poverty
Demographics Similar to Ethiopians by Poverty
In terms of poverty, the demographic groups most similar to Ethiopians are Immigrants from Fiji (12.2%, a difference of 0.010%), Immigrants from Ethiopia (12.2%, a difference of 0.050%), Colombian (12.2%, a difference of 0.12%), Immigrants from Nepal (12.2%, a difference of 0.13%), and Immigrants from Albania (12.2%, a difference of 0.13%).
| Demographics | Rating | Rank | Poverty |
| Hungarians | 63.6 /100 | #155 | Good 12.2% |
| Scotch-Irish | 62.6 /100 | #156 | Good 12.2% |
| Costa Ricans | 62.2 /100 | #157 | Good 12.2% |
| Taiwanese | 61.8 /100 | #158 | Good 12.2% |
| Pennsylvania Germans | 60.8 /100 | #159 | Good 12.2% |
| Immigrants | Nepal | 60.4 /100 | #160 | Good 12.2% |
| Immigrants | Fiji | 59.1 /100 | #161 | Average 12.2% |
| Ethiopians | 59.1 /100 | #162 | Average 12.2% |
| Immigrants | Ethiopia | 58.6 /100 | #163 | Average 12.2% |
| Colombians | 57.8 /100 | #164 | Average 12.2% |
| Immigrants | Albania | 57.7 /100 | #165 | Average 12.2% |
| Venezuelans | 56.9 /100 | #166 | Average 12.2% |
| Immigrants | Chile | 56.7 /100 | #167 | Average 12.2% |
| Immigrants | Venezuela | 56.5 /100 | #168 | Average 12.2% |
| Whites/Caucasians | 55.4 /100 | #169 | Average 12.3% |
Demographics Similar to Immigrants from Uganda by Poverty
In terms of poverty, the demographic groups most similar to Immigrants from Uganda are Spaniard (12.8%, a difference of 0.0%), Immigrants from Kenya (12.8%, a difference of 0.16%), Immigrants from Uruguay (12.8%, a difference of 0.16%), Hmong (12.8%, a difference of 0.26%), and Immigrants from Lebanon (12.8%, a difference of 0.35%).
| Demographics | Rating | Rank | Poverty |
| Arabs | 21.1 /100 | #194 | Fair 12.7% |
| Immigrants | Kuwait | 20.9 /100 | #195 | Fair 12.7% |
| Iraqis | 20.8 /100 | #196 | Fair 12.7% |
| Immigrants | Lebanon | 18.7 /100 | #197 | Poor 12.8% |
| Spanish | 18.7 /100 | #198 | Poor 12.8% |
| Immigrants | Kenya | 17.5 /100 | #199 | Poor 12.8% |
| Spaniards | 16.5 /100 | #200 | Poor 12.8% |
| Immigrants | Uganda | 16.5 /100 | #201 | Poor 12.8% |
| Immigrants | Uruguay | 15.6 /100 | #202 | Poor 12.8% |
| Hmong | 15.0 /100 | #203 | Poor 12.8% |
| Immigrants | Western Asia | 14.1 /100 | #204 | Poor 12.9% |
| Tsimshian | 9.2 /100 | #205 | Tragic 13.0% |
| Immigrants | Eastern Africa | 7.0 /100 | #206 | Tragic 13.1% |
| Panamanians | 6.6 /100 | #207 | Tragic 13.1% |
| Ugandans | 6.2 /100 | #208 | Tragic 13.1% |