Ethiopian vs Israeli Poverty
COMPARE
Ethiopian
Israeli
Poverty
Poverty Comparison
Ethiopians
Israelis
12.2%
POVERTY
59.1/ 100
METRIC RATING
162nd/ 347
METRIC RANK
12.5%
POVERTY
36.4/ 100
METRIC RATING
185th/ 347
METRIC RANK
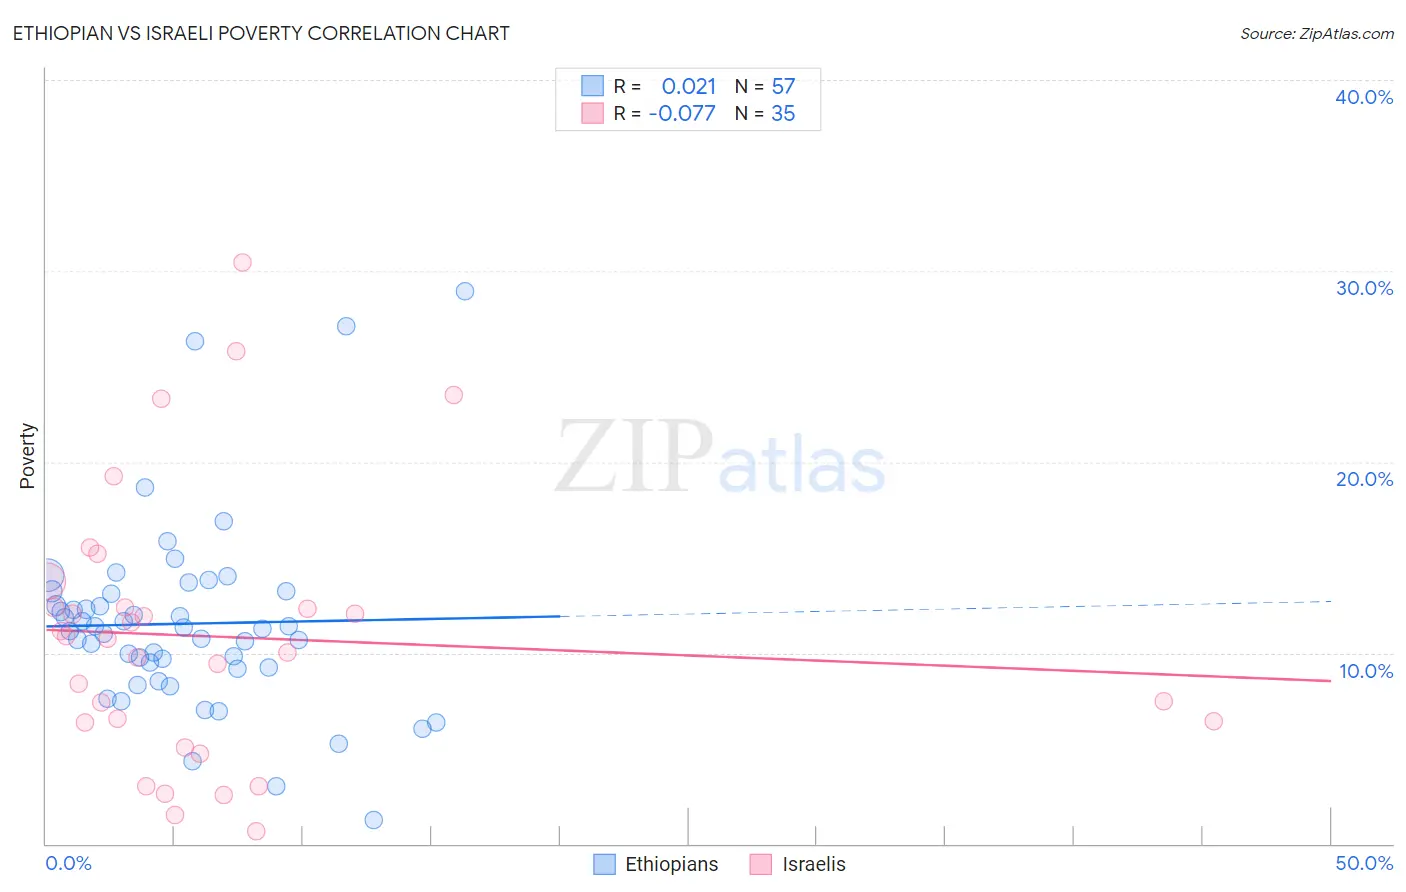
Ethiopian vs Israeli Poverty Correlation Chart
The statistical analysis conducted on geographies consisting of 223,124,419 people shows no correlation between the proportion of Ethiopians and poverty level in the United States with a correlation coefficient (R) of 0.021 and weighted average of 12.2%. Similarly, the statistical analysis conducted on geographies consisting of 211,053,584 people shows a slight negative correlation between the proportion of Israelis and poverty level in the United States with a correlation coefficient (R) of -0.077 and weighted average of 12.5%, a difference of 2.3%.
Poverty Correlation Summary
| Measurement | Ethiopian | Israeli |
| Minimum | 1.3% | 0.63% |
| Maximum | 28.9% | 30.5% |
| Range | 27.7% | 29.8% |
| Mean | 11.5% | 10.8% |
| Median | 11.3% | 10.7% |
| Interquartile 25% (IQ1) | 9.2% | 6.3% |
| Interquartile 75% (IQ3) | 13.1% | 12.4% |
| Interquartile Range (IQR) | 3.9% | 6.0% |
| Standard Deviation (Sample) | 5.0% | 7.0% |
| Standard Deviation (Population) | 4.9% | 6.9% |
Similar Demographics by Poverty
Demographics Similar to Ethiopians by Poverty
In terms of poverty, the demographic groups most similar to Ethiopians are Immigrants from Fiji (12.2%, a difference of 0.010%), Immigrants from Ethiopia (12.2%, a difference of 0.050%), Colombian (12.2%, a difference of 0.12%), Immigrants from Nepal (12.2%, a difference of 0.13%), and Immigrants from Albania (12.2%, a difference of 0.13%).
| Demographics | Rating | Rank | Poverty |
| Hungarians | 63.6 /100 | #155 | Good 12.2% |
| Scotch-Irish | 62.6 /100 | #156 | Good 12.2% |
| Costa Ricans | 62.2 /100 | #157 | Good 12.2% |
| Taiwanese | 61.8 /100 | #158 | Good 12.2% |
| Pennsylvania Germans | 60.8 /100 | #159 | Good 12.2% |
| Immigrants | Nepal | 60.4 /100 | #160 | Good 12.2% |
| Immigrants | Fiji | 59.1 /100 | #161 | Average 12.2% |
| Ethiopians | 59.1 /100 | #162 | Average 12.2% |
| Immigrants | Ethiopia | 58.6 /100 | #163 | Average 12.2% |
| Colombians | 57.8 /100 | #164 | Average 12.2% |
| Immigrants | Albania | 57.7 /100 | #165 | Average 12.2% |
| Venezuelans | 56.9 /100 | #166 | Average 12.2% |
| Immigrants | Chile | 56.7 /100 | #167 | Average 12.2% |
| Immigrants | Venezuela | 56.5 /100 | #168 | Average 12.2% |
| Whites/Caucasians | 55.4 /100 | #169 | Average 12.3% |
Demographics Similar to Israelis by Poverty
In terms of poverty, the demographic groups most similar to Israelis are Immigrants from Sierra Leone (12.5%, a difference of 0.020%), Kenyan (12.5%, a difference of 0.24%), Hawaiian (12.5%, a difference of 0.25%), Immigrants from Costa Rica (12.5%, a difference of 0.34%), and Aleut (12.5%, a difference of 0.34%).
| Demographics | Rating | Rank | Poverty |
| Uruguayans | 44.7 /100 | #178 | Average 12.4% |
| Immigrants | Morocco | 44.0 /100 | #179 | Average 12.4% |
| Mongolians | 43.6 /100 | #180 | Average 12.4% |
| Immigrants | Afghanistan | 42.1 /100 | #181 | Average 12.4% |
| Immigrants | Cameroon | 41.7 /100 | #182 | Average 12.4% |
| Immigrants | Iraq | 40.2 /100 | #183 | Average 12.4% |
| Kenyans | 38.8 /100 | #184 | Fair 12.5% |
| Israelis | 36.4 /100 | #185 | Fair 12.5% |
| Immigrants | Sierra Leone | 36.3 /100 | #186 | Fair 12.5% |
| Hawaiians | 34.1 /100 | #187 | Fair 12.5% |
| Immigrants | Costa Rica | 33.3 /100 | #188 | Fair 12.5% |
| Aleuts | 33.2 /100 | #189 | Fair 12.5% |
| Immigrants | South America | 32.3 /100 | #190 | Fair 12.5% |
| Sierra Leoneans | 31.5 /100 | #191 | Fair 12.6% |
| South American Indians | 23.3 /100 | #192 | Fair 12.7% |