Ethiopian vs Yuman Divorced or Separated
COMPARE
Ethiopian
Yuman
Divorced or Separated
Divorced or Separated Comparison
Ethiopians
Yuman
12.0%
DIVORCED OR SEPARATED
58.5/ 100
METRIC RATING
167th/ 347
METRIC RANK
12.6%
DIVORCED OR SEPARATED
0.6/ 100
METRIC RATING
259th/ 347
METRIC RANK
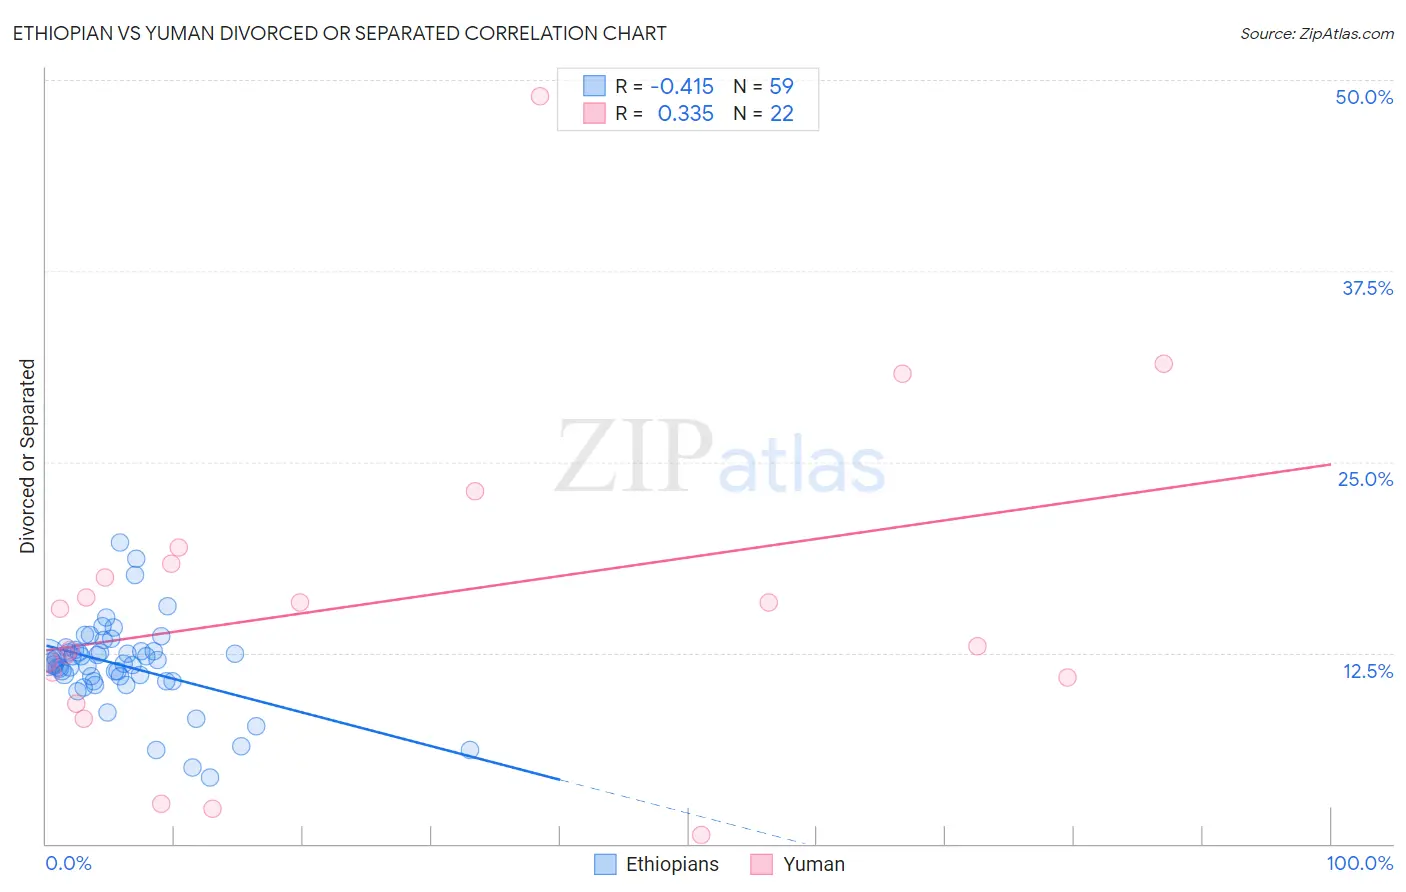
Ethiopian vs Yuman Divorced or Separated Correlation Chart
The statistical analysis conducted on geographies consisting of 223,166,328 people shows a moderate negative correlation between the proportion of Ethiopians and percentage of population currently divorced or separated in the United States with a correlation coefficient (R) of -0.415 and weighted average of 12.0%. Similarly, the statistical analysis conducted on geographies consisting of 40,695,107 people shows a mild positive correlation between the proportion of Yuman and percentage of population currently divorced or separated in the United States with a correlation coefficient (R) of 0.335 and weighted average of 12.6%, a difference of 4.8%.
Divorced or Separated Correlation Summary
| Measurement | Ethiopian | Yuman |
| Minimum | 4.3% | 0.60% |
| Maximum | 19.7% | 48.9% |
| Range | 15.4% | 48.3% |
| Mean | 11.7% | 15.8% |
| Median | 11.8% | 14.1% |
| Interquartile 25% (IQ1) | 10.7% | 10.9% |
| Interquartile 75% (IQ3) | 12.6% | 18.3% |
| Interquartile Range (IQR) | 1.9% | 7.4% |
| Standard Deviation (Sample) | 2.8% | 10.7% |
| Standard Deviation (Population) | 2.8% | 10.5% |
Similar Demographics by Divorced or Separated
Demographics Similar to Ethiopians by Divorced or Separated
In terms of divorced or separated, the demographic groups most similar to Ethiopians are Serbian (12.0%, a difference of 0.050%), Immigrants from Peru (12.0%, a difference of 0.050%), Tohono O'odham (12.0%, a difference of 0.070%), Mexican American Indian (12.0%, a difference of 0.10%), and German Russian (12.0%, a difference of 0.12%).
| Demographics | Rating | Rank | Divorced or Separated |
| Immigrants | Scotland | 65.8 /100 | #160 | Good 12.0% |
| Marshallese | 64.6 /100 | #161 | Good 12.0% |
| Samoans | 64.3 /100 | #162 | Good 12.0% |
| Navajo | 63.9 /100 | #163 | Good 12.0% |
| Swiss | 63.6 /100 | #164 | Good 12.0% |
| German Russians | 61.8 /100 | #165 | Good 12.0% |
| Tohono O'odham | 60.4 /100 | #166 | Good 12.0% |
| Ethiopians | 58.5 /100 | #167 | Average 12.0% |
| Serbians | 57.1 /100 | #168 | Average 12.0% |
| Immigrants | Peru | 57.0 /100 | #169 | Average 12.0% |
| Mexican American Indians | 55.8 /100 | #170 | Average 12.0% |
| Costa Ricans | 53.3 /100 | #171 | Average 12.0% |
| Immigrants | Mexico | 53.2 /100 | #172 | Average 12.0% |
| Immigrants | Moldova | 50.4 /100 | #173 | Average 12.1% |
| Hawaiians | 50.0 /100 | #174 | Average 12.1% |
Demographics Similar to Yuman by Divorced or Separated
In terms of divorced or separated, the demographic groups most similar to Yuman are Immigrants from Uruguay (12.6%, a difference of 0.0%), Immigrants from Somalia (12.6%, a difference of 0.020%), Indonesian (12.6%, a difference of 0.020%), Immigrants from Colombia (12.6%, a difference of 0.030%), and Immigrants from Dominica (12.6%, a difference of 0.030%).
| Demographics | Rating | Rank | Divorced or Separated |
| Liberians | 0.9 /100 | #252 | Tragic 12.6% |
| Somalis | 0.9 /100 | #253 | Tragic 12.6% |
| Senegalese | 0.8 /100 | #254 | Tragic 12.6% |
| Welsh | 0.7 /100 | #255 | Tragic 12.6% |
| Immigrants | Colombia | 0.6 /100 | #256 | Tragic 12.6% |
| Immigrants | Somalia | 0.6 /100 | #257 | Tragic 12.6% |
| Indonesians | 0.6 /100 | #258 | Tragic 12.6% |
| Yuman | 0.6 /100 | #259 | Tragic 12.6% |
| Immigrants | Uruguay | 0.6 /100 | #260 | Tragic 12.6% |
| Immigrants | Dominica | 0.5 /100 | #261 | Tragic 12.6% |
| Basques | 0.5 /100 | #262 | Tragic 12.6% |
| Immigrants | Panama | 0.5 /100 | #263 | Tragic 12.6% |
| English | 0.5 /100 | #264 | Tragic 12.6% |
| Immigrants | Senegal | 0.5 /100 | #265 | Tragic 12.6% |
| Whites/Caucasians | 0.5 /100 | #266 | Tragic 12.6% |