Ethiopian vs Barbadian Poverty
COMPARE
Ethiopian
Barbadian
Poverty
Poverty Comparison
Ethiopians
Barbadians
12.2%
POVERTY
59.1/ 100
METRIC RATING
162nd/ 347
METRIC RANK
14.8%
POVERTY
0.0/ 100
METRIC RATING
274th/ 347
METRIC RANK
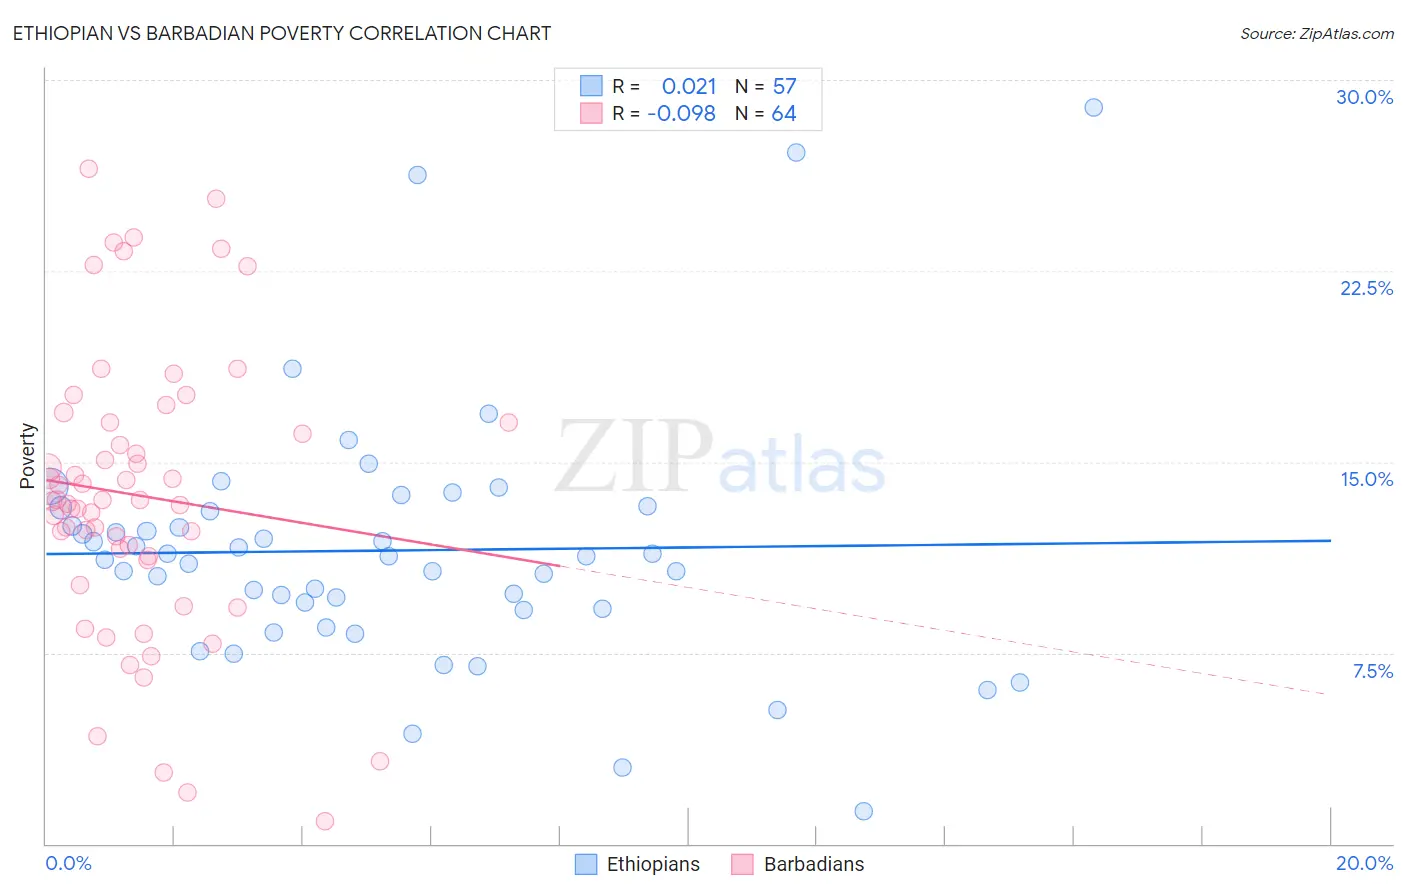
Ethiopian vs Barbadian Poverty Correlation Chart
The statistical analysis conducted on geographies consisting of 223,124,419 people shows no correlation between the proportion of Ethiopians and poverty level in the United States with a correlation coefficient (R) of 0.021 and weighted average of 12.2%. Similarly, the statistical analysis conducted on geographies consisting of 141,278,644 people shows a slight negative correlation between the proportion of Barbadians and poverty level in the United States with a correlation coefficient (R) of -0.098 and weighted average of 14.8%, a difference of 21.3%.
Poverty Correlation Summary
| Measurement | Ethiopian | Barbadian |
| Minimum | 1.3% | 0.88% |
| Maximum | 28.9% | 26.5% |
| Range | 27.7% | 25.6% |
| Mean | 11.5% | 13.7% |
| Median | 11.3% | 13.5% |
| Interquartile 25% (IQ1) | 9.2% | 11.2% |
| Interquartile 75% (IQ3) | 13.1% | 16.5% |
| Interquartile Range (IQR) | 3.9% | 5.3% |
| Standard Deviation (Sample) | 5.0% | 5.6% |
| Standard Deviation (Population) | 4.9% | 5.6% |
Similar Demographics by Poverty
Demographics Similar to Ethiopians by Poverty
In terms of poverty, the demographic groups most similar to Ethiopians are Immigrants from Fiji (12.2%, a difference of 0.010%), Immigrants from Ethiopia (12.2%, a difference of 0.050%), Colombian (12.2%, a difference of 0.12%), Immigrants from Nepal (12.2%, a difference of 0.13%), and Immigrants from Albania (12.2%, a difference of 0.13%).
| Demographics | Rating | Rank | Poverty |
| Hungarians | 63.6 /100 | #155 | Good 12.2% |
| Scotch-Irish | 62.6 /100 | #156 | Good 12.2% |
| Costa Ricans | 62.2 /100 | #157 | Good 12.2% |
| Taiwanese | 61.8 /100 | #158 | Good 12.2% |
| Pennsylvania Germans | 60.8 /100 | #159 | Good 12.2% |
| Immigrants | Nepal | 60.4 /100 | #160 | Good 12.2% |
| Immigrants | Fiji | 59.1 /100 | #161 | Average 12.2% |
| Ethiopians | 59.1 /100 | #162 | Average 12.2% |
| Immigrants | Ethiopia | 58.6 /100 | #163 | Average 12.2% |
| Colombians | 57.8 /100 | #164 | Average 12.2% |
| Immigrants | Albania | 57.7 /100 | #165 | Average 12.2% |
| Venezuelans | 56.9 /100 | #166 | Average 12.2% |
| Immigrants | Chile | 56.7 /100 | #167 | Average 12.2% |
| Immigrants | Venezuela | 56.5 /100 | #168 | Average 12.2% |
| Whites/Caucasians | 55.4 /100 | #169 | Average 12.3% |
Demographics Similar to Barbadians by Poverty
In terms of poverty, the demographic groups most similar to Barbadians are Immigrants from West Indies (14.8%, a difference of 0.040%), Immigrants from Bahamas (14.8%, a difference of 0.040%), Bangladeshi (14.8%, a difference of 0.090%), Belizean (14.8%, a difference of 0.11%), and Spanish American (14.7%, a difference of 0.39%).
| Demographics | Rating | Rank | Poverty |
| Iroquois | 0.1 /100 | #267 | Tragic 14.5% |
| Sub-Saharan Africans | 0.1 /100 | #268 | Tragic 14.5% |
| Immigrants | Cuba | 0.1 /100 | #269 | Tragic 14.6% |
| Central Americans | 0.1 /100 | #270 | Tragic 14.6% |
| Shoshone | 0.0 /100 | #271 | Tragic 14.7% |
| Chickasaw | 0.0 /100 | #272 | Tragic 14.7% |
| Spanish Americans | 0.0 /100 | #273 | Tragic 14.7% |
| Barbadians | 0.0 /100 | #274 | Tragic 14.8% |
| Immigrants | West Indies | 0.0 /100 | #275 | Tragic 14.8% |
| Immigrants | Bahamas | 0.0 /100 | #276 | Tragic 14.8% |
| Bangladeshis | 0.0 /100 | #277 | Tragic 14.8% |
| Belizeans | 0.0 /100 | #278 | Tragic 14.8% |
| Immigrants | St. Vincent and the Grenadines | 0.0 /100 | #279 | Tragic 14.9% |
| Haitians | 0.0 /100 | #280 | Tragic 14.9% |
| Immigrants | Barbados | 0.0 /100 | #281 | Tragic 14.9% |