Ethiopian vs Immigrants from Kuwait Poverty
COMPARE
Ethiopian
Immigrants from Kuwait
Poverty
Poverty Comparison
Ethiopians
Immigrants from Kuwait
12.2%
POVERTY
59.1/ 100
METRIC RATING
162nd/ 347
METRIC RANK
12.7%
POVERTY
20.9/ 100
METRIC RATING
195th/ 347
METRIC RANK
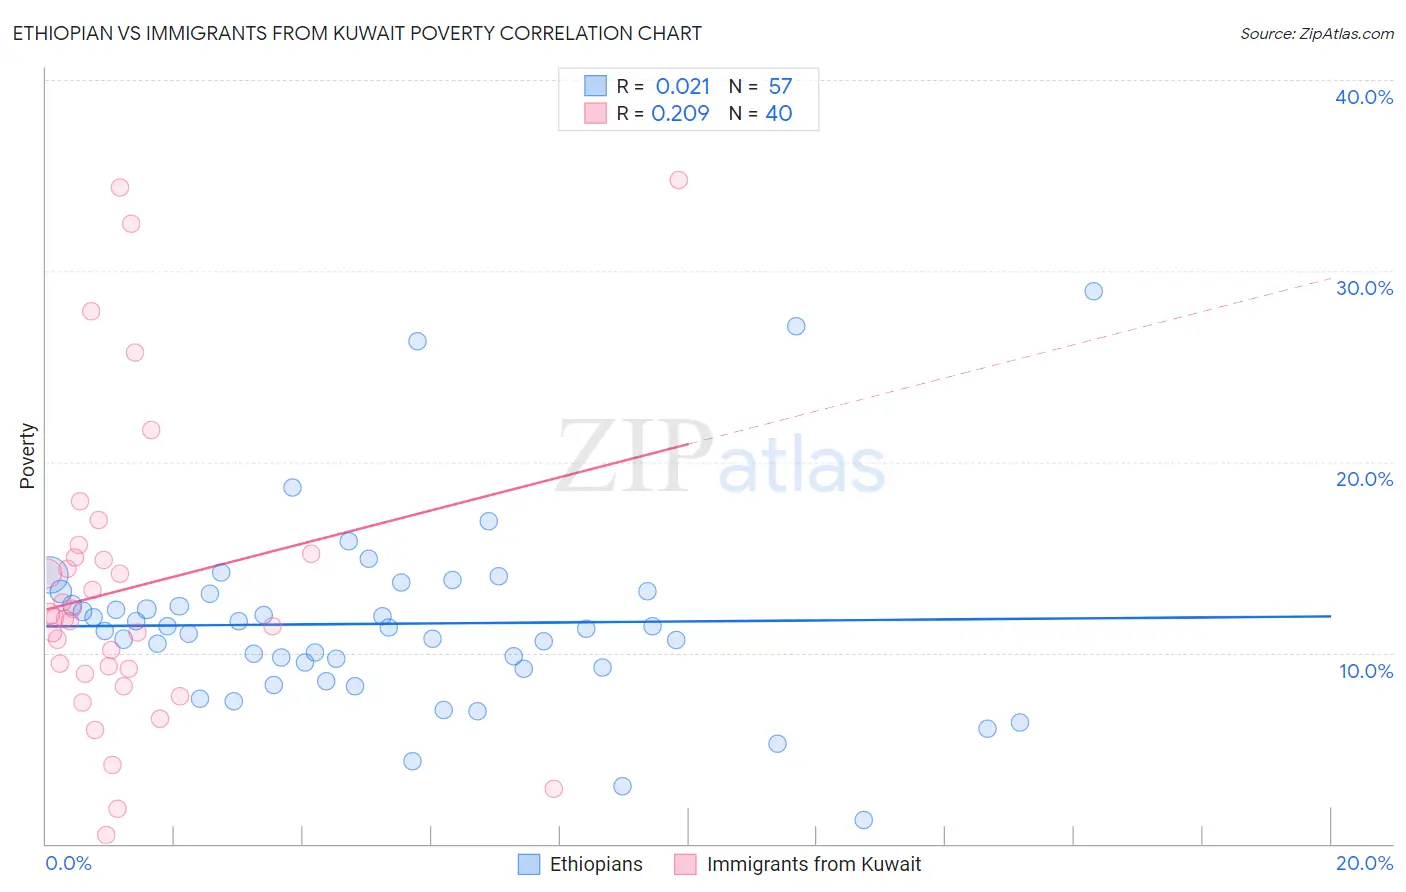
Ethiopian vs Immigrants from Kuwait Poverty Correlation Chart
The statistical analysis conducted on geographies consisting of 223,124,419 people shows no correlation between the proportion of Ethiopians and poverty level in the United States with a correlation coefficient (R) of 0.021 and weighted average of 12.2%. Similarly, the statistical analysis conducted on geographies consisting of 136,889,651 people shows a weak positive correlation between the proportion of Immigrants from Kuwait and poverty level in the United States with a correlation coefficient (R) of 0.209 and weighted average of 12.7%, a difference of 4.2%.
Poverty Correlation Summary
| Measurement | Ethiopian | Immigrants from Kuwait |
| Minimum | 1.3% | 0.47% |
| Maximum | 28.9% | 34.8% |
| Range | 27.7% | 34.3% |
| Mean | 11.5% | 13.4% |
| Median | 11.3% | 11.8% |
| Interquartile 25% (IQ1) | 9.2% | 9.0% |
| Interquartile 75% (IQ3) | 13.1% | 15.1% |
| Interquartile Range (IQR) | 3.9% | 6.1% |
| Standard Deviation (Sample) | 5.0% | 8.1% |
| Standard Deviation (Population) | 4.9% | 8.0% |
Similar Demographics by Poverty
Demographics Similar to Ethiopians by Poverty
In terms of poverty, the demographic groups most similar to Ethiopians are Immigrants from Fiji (12.2%, a difference of 0.010%), Immigrants from Ethiopia (12.2%, a difference of 0.050%), Colombian (12.2%, a difference of 0.12%), Immigrants from Nepal (12.2%, a difference of 0.13%), and Immigrants from Albania (12.2%, a difference of 0.13%).
| Demographics | Rating | Rank | Poverty |
| Hungarians | 63.6 /100 | #155 | Good 12.2% |
| Scotch-Irish | 62.6 /100 | #156 | Good 12.2% |
| Costa Ricans | 62.2 /100 | #157 | Good 12.2% |
| Taiwanese | 61.8 /100 | #158 | Good 12.2% |
| Pennsylvania Germans | 60.8 /100 | #159 | Good 12.2% |
| Immigrants | Nepal | 60.4 /100 | #160 | Good 12.2% |
| Immigrants | Fiji | 59.1 /100 | #161 | Average 12.2% |
| Ethiopians | 59.1 /100 | #162 | Average 12.2% |
| Immigrants | Ethiopia | 58.6 /100 | #163 | Average 12.2% |
| Colombians | 57.8 /100 | #164 | Average 12.2% |
| Immigrants | Albania | 57.7 /100 | #165 | Average 12.2% |
| Venezuelans | 56.9 /100 | #166 | Average 12.2% |
| Immigrants | Chile | 56.7 /100 | #167 | Average 12.2% |
| Immigrants | Venezuela | 56.5 /100 | #168 | Average 12.2% |
| Whites/Caucasians | 55.4 /100 | #169 | Average 12.3% |
Demographics Similar to Immigrants from Kuwait by Poverty
In terms of poverty, the demographic groups most similar to Immigrants from Kuwait are Iraqi (12.7%, a difference of 0.020%), Arab (12.7%, a difference of 0.030%), Delaware (12.7%, a difference of 0.080%), Immigrants from Lebanon (12.8%, a difference of 0.32%), and South American Indian (12.7%, a difference of 0.33%).
| Demographics | Rating | Rank | Poverty |
| Immigrants | Costa Rica | 33.3 /100 | #188 | Fair 12.5% |
| Aleuts | 33.2 /100 | #189 | Fair 12.5% |
| Immigrants | South America | 32.3 /100 | #190 | Fair 12.5% |
| Sierra Leoneans | 31.5 /100 | #191 | Fair 12.6% |
| South American Indians | 23.3 /100 | #192 | Fair 12.7% |
| Delaware | 21.4 /100 | #193 | Fair 12.7% |
| Arabs | 21.1 /100 | #194 | Fair 12.7% |
| Immigrants | Kuwait | 20.9 /100 | #195 | Fair 12.7% |
| Iraqis | 20.8 /100 | #196 | Fair 12.7% |
| Immigrants | Lebanon | 18.7 /100 | #197 | Poor 12.8% |
| Spanish | 18.7 /100 | #198 | Poor 12.8% |
| Immigrants | Kenya | 17.5 /100 | #199 | Poor 12.8% |
| Spaniards | 16.5 /100 | #200 | Poor 12.8% |
| Immigrants | Uganda | 16.5 /100 | #201 | Poor 12.8% |
| Immigrants | Uruguay | 15.6 /100 | #202 | Poor 12.8% |