Ethiopian vs Basque Poverty
COMPARE
Ethiopian
Basque
Poverty
Poverty Comparison
Ethiopians
Basques
12.2%
POVERTY
59.1/ 100
METRIC RATING
162nd/ 347
METRIC RANK
11.9%
POVERTY
80.4/ 100
METRIC RATING
142nd/ 347
METRIC RANK
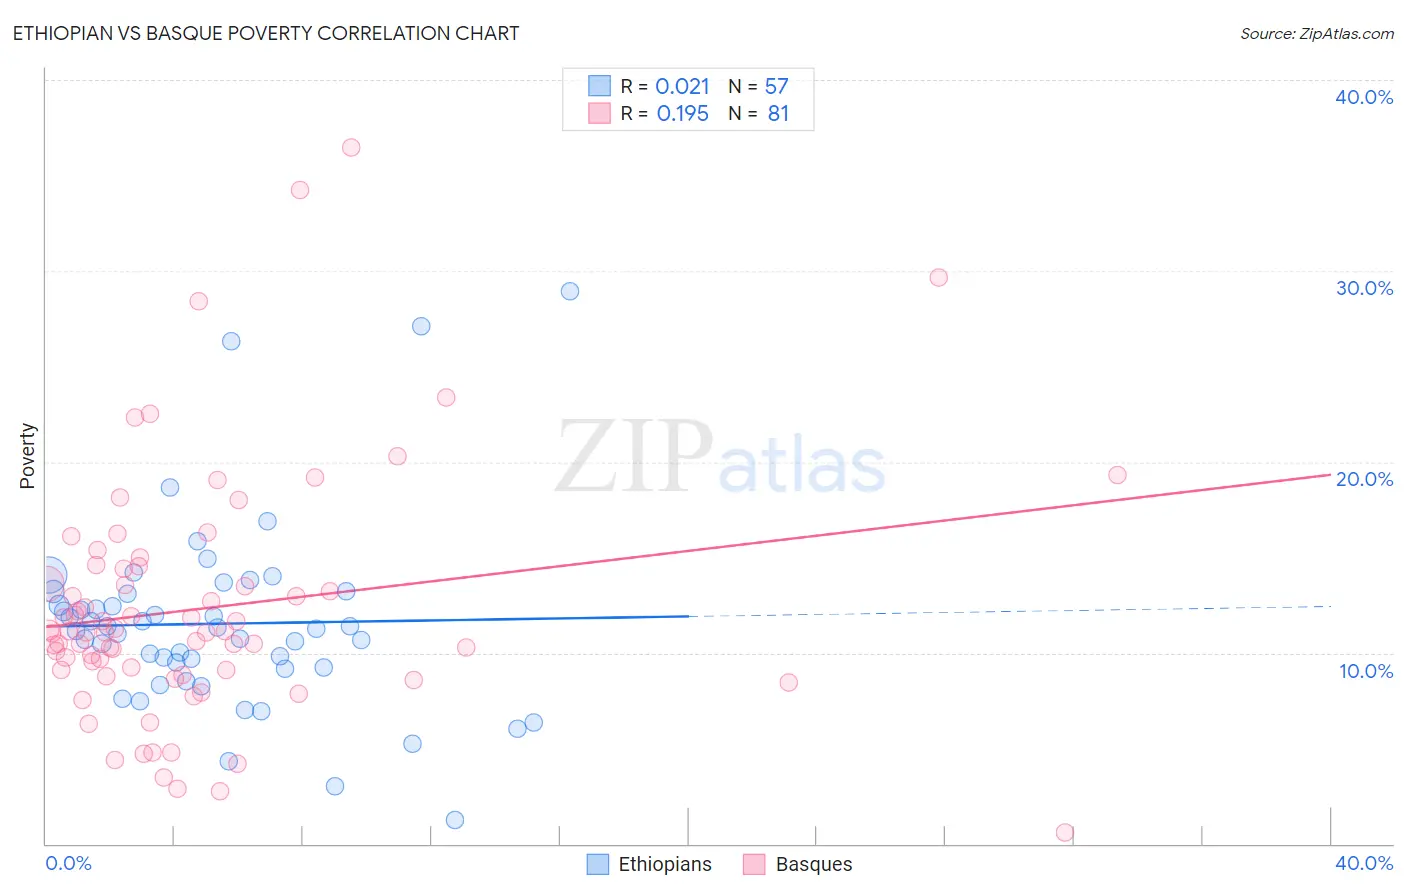
Ethiopian vs Basque Poverty Correlation Chart
The statistical analysis conducted on geographies consisting of 223,124,419 people shows no correlation between the proportion of Ethiopians and poverty level in the United States with a correlation coefficient (R) of 0.021 and weighted average of 12.2%. Similarly, the statistical analysis conducted on geographies consisting of 165,732,403 people shows a poor positive correlation between the proportion of Basques and poverty level in the United States with a correlation coefficient (R) of 0.195 and weighted average of 11.9%, a difference of 2.6%.
Poverty Correlation Summary
| Measurement | Ethiopian | Basque |
| Minimum | 1.3% | 0.59% |
| Maximum | 28.9% | 36.5% |
| Range | 27.7% | 35.9% |
| Mean | 11.5% | 12.3% |
| Median | 11.3% | 11.1% |
| Interquartile 25% (IQ1) | 9.2% | 9.0% |
| Interquartile 75% (IQ3) | 13.1% | 14.5% |
| Interquartile Range (IQR) | 3.9% | 5.5% |
| Standard Deviation (Sample) | 5.0% | 6.4% |
| Standard Deviation (Population) | 4.9% | 6.4% |
Demographics Similar to Ethiopians and Basques by Poverty
In terms of poverty, the demographic groups most similar to Ethiopians are Immigrants from Fiji (12.2%, a difference of 0.010%), Immigrants from Nepal (12.2%, a difference of 0.13%), Pennsylvania German (12.2%, a difference of 0.18%), Taiwanese (12.2%, a difference of 0.28%), and Costa Rican (12.2%, a difference of 0.32%). Similarly, the demographic groups most similar to Basques are Brazilian (11.9%, a difference of 0.11%), Icelander (11.9%, a difference of 0.38%), Syrian (12.0%, a difference of 0.77%), Afghan (12.0%, a difference of 0.80%), and Immigrants from Bosnia and Herzegovina (12.0%, a difference of 0.96%).
| Demographics | Rating | Rank | Poverty |
| Basques | 80.4 /100 | #142 | Excellent 11.9% |
| Brazilians | 79.7 /100 | #143 | Good 11.9% |
| Icelanders | 77.9 /100 | #144 | Good 11.9% |
| Syrians | 75.1 /100 | #145 | Good 12.0% |
| Afghans | 74.9 /100 | #146 | Good 12.0% |
| Immigrants | Bosnia and Herzegovina | 73.7 /100 | #147 | Good 12.0% |
| Immigrants | Germany | 72.7 /100 | #148 | Good 12.0% |
| Immigrants | Malaysia | 72.7 /100 | #149 | Good 12.0% |
| Immigrants | Kazakhstan | 72.3 /100 | #150 | Good 12.0% |
| Samoans | 71.9 /100 | #151 | Good 12.0% |
| Armenians | 67.6 /100 | #152 | Good 12.1% |
| Immigrants | Northern Africa | 63.9 /100 | #153 | Good 12.1% |
| Guamanians/Chamorros | 63.9 /100 | #154 | Good 12.1% |
| Hungarians | 63.6 /100 | #155 | Good 12.2% |
| Scotch-Irish | 62.6 /100 | #156 | Good 12.2% |
| Costa Ricans | 62.2 /100 | #157 | Good 12.2% |
| Taiwanese | 61.8 /100 | #158 | Good 12.2% |
| Pennsylvania Germans | 60.8 /100 | #159 | Good 12.2% |
| Immigrants | Nepal | 60.4 /100 | #160 | Good 12.2% |
| Immigrants | Fiji | 59.1 /100 | #161 | Average 12.2% |
| Ethiopians | 59.1 /100 | #162 | Average 12.2% |