Ethiopian vs Czechoslovakian Poverty
COMPARE
Ethiopian
Czechoslovakian
Poverty
Poverty Comparison
Ethiopians
Czechoslovakians
12.2%
POVERTY
59.1/ 100
METRIC RATING
162nd/ 347
METRIC RANK
11.4%
POVERTY
95.7/ 100
METRIC RATING
89th/ 347
METRIC RANK
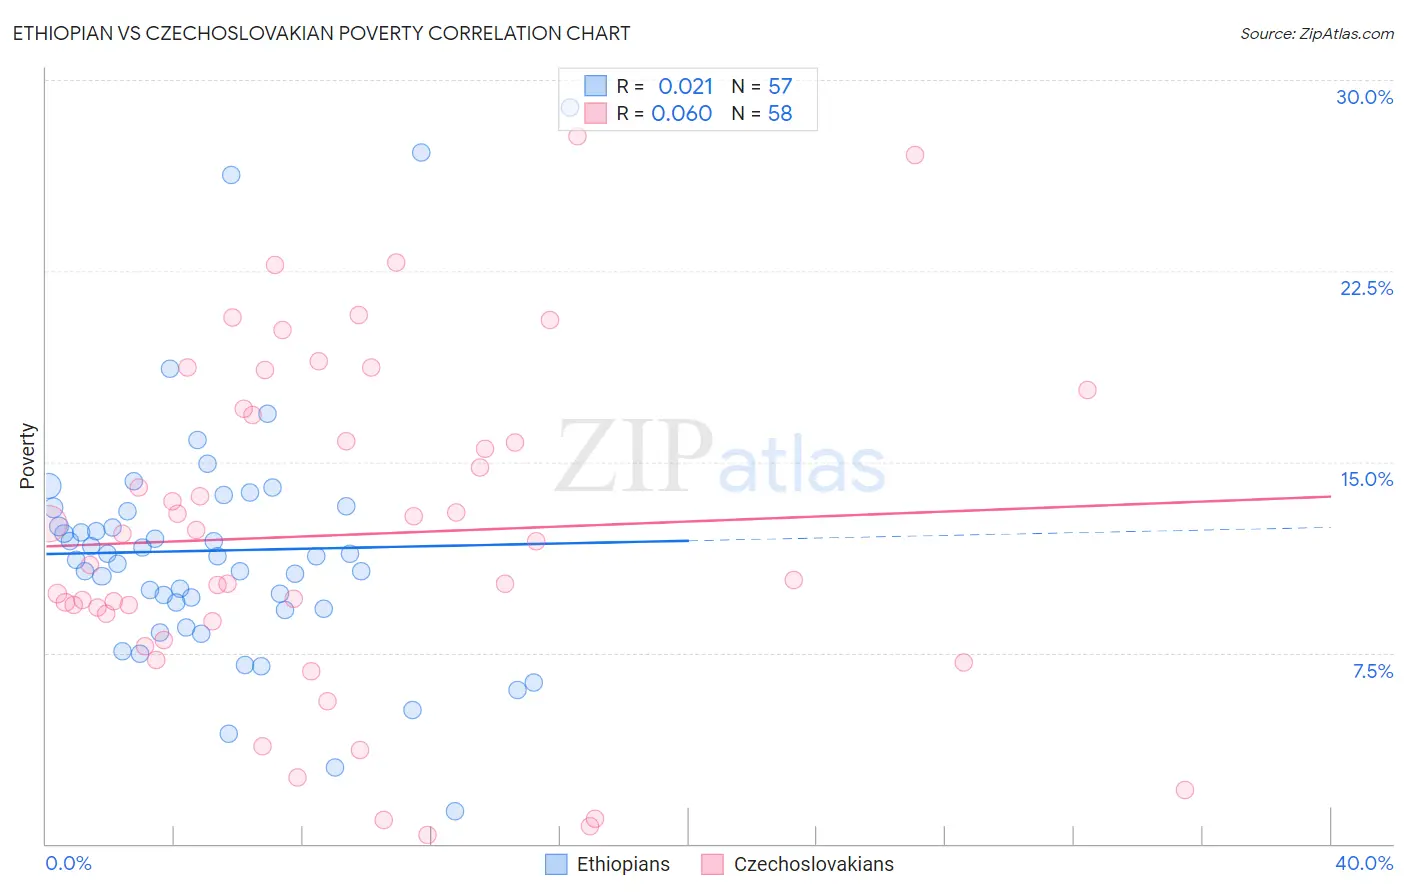
Ethiopian vs Czechoslovakian Poverty Correlation Chart
The statistical analysis conducted on geographies consisting of 223,124,419 people shows no correlation between the proportion of Ethiopians and poverty level in the United States with a correlation coefficient (R) of 0.021 and weighted average of 12.2%. Similarly, the statistical analysis conducted on geographies consisting of 368,518,810 people shows a slight positive correlation between the proportion of Czechoslovakians and poverty level in the United States with a correlation coefficient (R) of 0.060 and weighted average of 11.4%, a difference of 7.2%.
Poverty Correlation Summary
| Measurement | Ethiopian | Czechoslovakian |
| Minimum | 1.3% | 0.33% |
| Maximum | 28.9% | 27.8% |
| Range | 27.7% | 27.5% |
| Mean | 11.5% | 12.1% |
| Median | 11.3% | 11.4% |
| Interquartile 25% (IQ1) | 9.2% | 8.7% |
| Interquartile 75% (IQ3) | 13.1% | 16.8% |
| Interquartile Range (IQR) | 3.9% | 8.1% |
| Standard Deviation (Sample) | 5.0% | 6.5% |
| Standard Deviation (Population) | 4.9% | 6.4% |
Similar Demographics by Poverty
Demographics Similar to Ethiopians by Poverty
In terms of poverty, the demographic groups most similar to Ethiopians are Immigrants from Fiji (12.2%, a difference of 0.010%), Immigrants from Ethiopia (12.2%, a difference of 0.050%), Colombian (12.2%, a difference of 0.12%), Immigrants from Nepal (12.2%, a difference of 0.13%), and Immigrants from Albania (12.2%, a difference of 0.13%).
| Demographics | Rating | Rank | Poverty |
| Hungarians | 63.6 /100 | #155 | Good 12.2% |
| Scotch-Irish | 62.6 /100 | #156 | Good 12.2% |
| Costa Ricans | 62.2 /100 | #157 | Good 12.2% |
| Taiwanese | 61.8 /100 | #158 | Good 12.2% |
| Pennsylvania Germans | 60.8 /100 | #159 | Good 12.2% |
| Immigrants | Nepal | 60.4 /100 | #160 | Good 12.2% |
| Immigrants | Fiji | 59.1 /100 | #161 | Average 12.2% |
| Ethiopians | 59.1 /100 | #162 | Average 12.2% |
| Immigrants | Ethiopia | 58.6 /100 | #163 | Average 12.2% |
| Colombians | 57.8 /100 | #164 | Average 12.2% |
| Immigrants | Albania | 57.7 /100 | #165 | Average 12.2% |
| Venezuelans | 56.9 /100 | #166 | Average 12.2% |
| Immigrants | Chile | 56.7 /100 | #167 | Average 12.2% |
| Immigrants | Venezuela | 56.5 /100 | #168 | Average 12.2% |
| Whites/Caucasians | 55.4 /100 | #169 | Average 12.3% |
Demographics Similar to Czechoslovakians by Poverty
In terms of poverty, the demographic groups most similar to Czechoslovakians are Belgian (11.4%, a difference of 0.040%), Immigrants from Denmark (11.4%, a difference of 0.17%), Jordanian (11.4%, a difference of 0.18%), Northern European (11.4%, a difference of 0.18%), and Immigrants from England (11.4%, a difference of 0.30%).
| Demographics | Rating | Rank | Poverty |
| Egyptians | 96.5 /100 | #82 | Exceptional 11.3% |
| Immigrants | Sweden | 96.3 /100 | #83 | Exceptional 11.3% |
| English | 96.3 /100 | #84 | Exceptional 11.3% |
| Immigrants | England | 96.2 /100 | #85 | Exceptional 11.4% |
| Jordanians | 96.0 /100 | #86 | Exceptional 11.4% |
| Northern Europeans | 96.0 /100 | #87 | Exceptional 11.4% |
| Belgians | 95.8 /100 | #88 | Exceptional 11.4% |
| Czechoslovakians | 95.7 /100 | #89 | Exceptional 11.4% |
| Immigrants | Denmark | 95.5 /100 | #90 | Exceptional 11.4% |
| Finns | 95.2 /100 | #91 | Exceptional 11.4% |
| British | 95.0 /100 | #92 | Exceptional 11.4% |
| Romanians | 94.9 /100 | #93 | Exceptional 11.4% |
| Paraguayans | 94.9 /100 | #94 | Exceptional 11.4% |
| Australians | 94.9 /100 | #95 | Exceptional 11.4% |
| Immigrants | South Africa | 94.7 /100 | #96 | Exceptional 11.5% |