Ethiopian vs Menominee Poverty
COMPARE
Ethiopian
Menominee
Poverty
Poverty Comparison
Ethiopians
Menominee
12.2%
POVERTY
59.1/ 100
METRIC RATING
162nd/ 347
METRIC RANK
16.4%
POVERTY
0.0/ 100
METRIC RATING
322nd/ 347
METRIC RANK
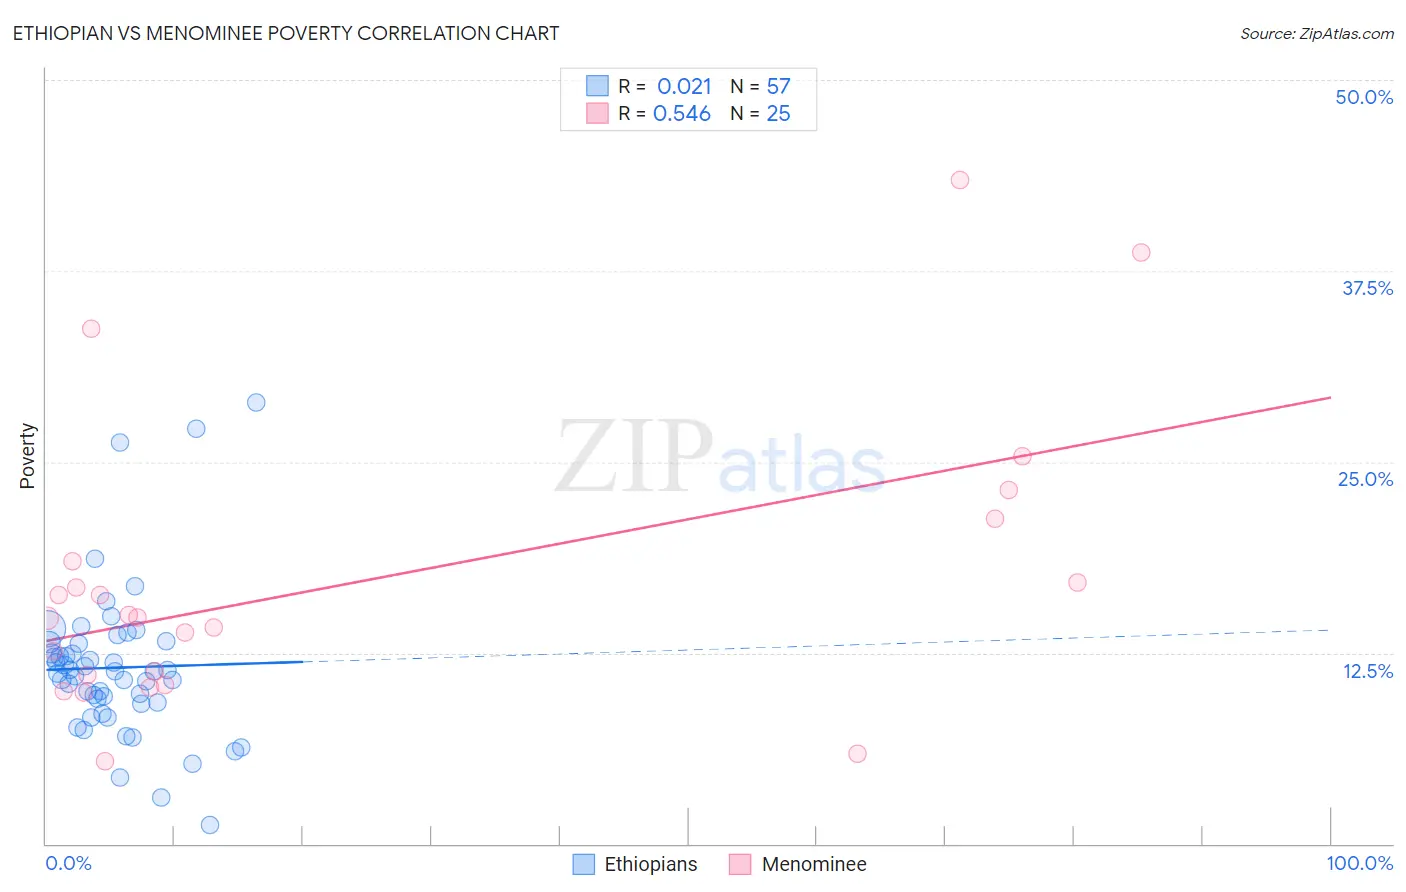
Ethiopian vs Menominee Poverty Correlation Chart
The statistical analysis conducted on geographies consisting of 223,124,419 people shows no correlation between the proportion of Ethiopians and poverty level in the United States with a correlation coefficient (R) of 0.021 and weighted average of 12.2%. Similarly, the statistical analysis conducted on geographies consisting of 45,777,730 people shows a substantial positive correlation between the proportion of Menominee and poverty level in the United States with a correlation coefficient (R) of 0.546 and weighted average of 16.4%, a difference of 34.7%.
Poverty Correlation Summary
| Measurement | Ethiopian | Menominee |
| Minimum | 1.3% | 5.4% |
| Maximum | 28.9% | 43.5% |
| Range | 27.7% | 38.1% |
| Mean | 11.5% | 17.2% |
| Median | 11.3% | 14.8% |
| Interquartile 25% (IQ1) | 9.2% | 10.7% |
| Interquartile 75% (IQ3) | 13.1% | 19.9% |
| Interquartile Range (IQR) | 3.9% | 9.2% |
| Standard Deviation (Sample) | 5.0% | 9.5% |
| Standard Deviation (Population) | 4.9% | 9.3% |
Similar Demographics by Poverty
Demographics Similar to Ethiopians by Poverty
In terms of poverty, the demographic groups most similar to Ethiopians are Immigrants from Fiji (12.2%, a difference of 0.010%), Immigrants from Ethiopia (12.2%, a difference of 0.050%), Colombian (12.2%, a difference of 0.12%), Immigrants from Nepal (12.2%, a difference of 0.13%), and Immigrants from Albania (12.2%, a difference of 0.13%).
| Demographics | Rating | Rank | Poverty |
| Hungarians | 63.6 /100 | #155 | Good 12.2% |
| Scotch-Irish | 62.6 /100 | #156 | Good 12.2% |
| Costa Ricans | 62.2 /100 | #157 | Good 12.2% |
| Taiwanese | 61.8 /100 | #158 | Good 12.2% |
| Pennsylvania Germans | 60.8 /100 | #159 | Good 12.2% |
| Immigrants | Nepal | 60.4 /100 | #160 | Good 12.2% |
| Immigrants | Fiji | 59.1 /100 | #161 | Average 12.2% |
| Ethiopians | 59.1 /100 | #162 | Average 12.2% |
| Immigrants | Ethiopia | 58.6 /100 | #163 | Average 12.2% |
| Colombians | 57.8 /100 | #164 | Average 12.2% |
| Immigrants | Albania | 57.7 /100 | #165 | Average 12.2% |
| Venezuelans | 56.9 /100 | #166 | Average 12.2% |
| Immigrants | Chile | 56.7 /100 | #167 | Average 12.2% |
| Immigrants | Venezuela | 56.5 /100 | #168 | Average 12.2% |
| Whites/Caucasians | 55.4 /100 | #169 | Average 12.3% |
Demographics Similar to Menominee by Poverty
In terms of poverty, the demographic groups most similar to Menominee are Colville (16.6%, a difference of 0.75%), Arapaho (16.3%, a difference of 0.96%), Yakama (16.7%, a difference of 1.3%), Central American Indian (16.7%, a difference of 1.5%), and Immigrants from Honduras (16.2%, a difference of 1.7%).
| Demographics | Rating | Rank | Poverty |
| British West Indians | 0.0 /100 | #315 | Tragic 15.9% |
| Hondurans | 0.0 /100 | #316 | Tragic 15.9% |
| U.S. Virgin Islanders | 0.0 /100 | #317 | Tragic 16.1% |
| Immigrants | Dominica | 0.0 /100 | #318 | Tragic 16.1% |
| Immigrants | Congo | 0.0 /100 | #319 | Tragic 16.1% |
| Immigrants | Honduras | 0.0 /100 | #320 | Tragic 16.2% |
| Arapaho | 0.0 /100 | #321 | Tragic 16.3% |
| Menominee | 0.0 /100 | #322 | Tragic 16.4% |
| Colville | 0.0 /100 | #323 | Tragic 16.6% |
| Yakama | 0.0 /100 | #324 | Tragic 16.7% |
| Central American Indians | 0.0 /100 | #325 | Tragic 16.7% |
| Paiute | 0.0 /100 | #326 | Tragic 16.7% |
| Kiowa | 0.0 /100 | #327 | Tragic 16.8% |
| Ute | 0.0 /100 | #328 | Tragic 16.9% |
| Blacks/African Americans | 0.0 /100 | #329 | Tragic 17.3% |