Ethiopian vs Immigrants from Morocco Poverty
COMPARE
Ethiopian
Immigrants from Morocco
Poverty
Poverty Comparison
Ethiopians
Immigrants from Morocco
12.2%
POVERTY
59.1/ 100
METRIC RATING
162nd/ 347
METRIC RANK
12.4%
POVERTY
44.0/ 100
METRIC RATING
179th/ 347
METRIC RANK
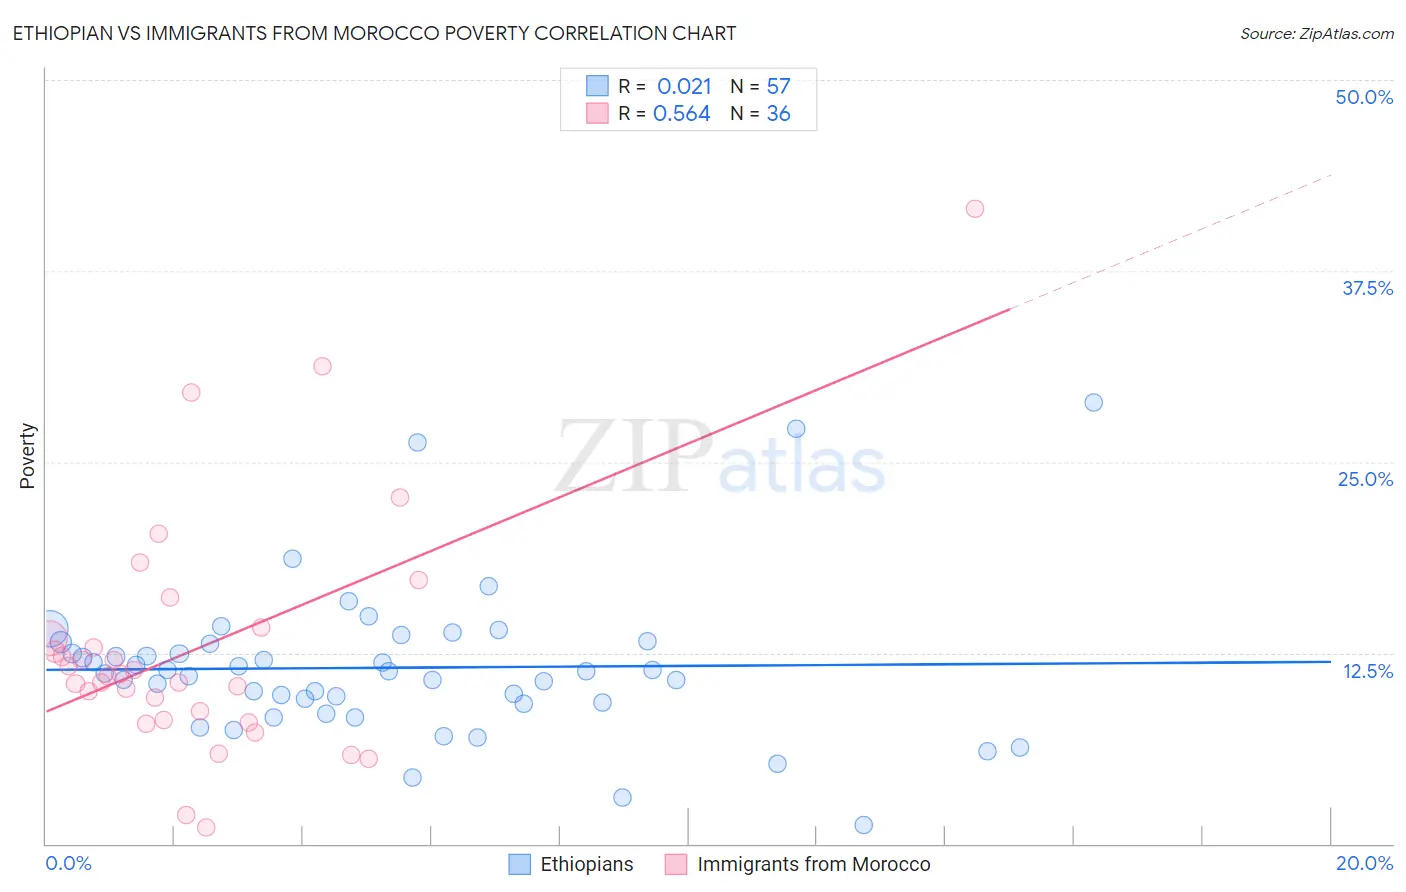
Ethiopian vs Immigrants from Morocco Poverty Correlation Chart
The statistical analysis conducted on geographies consisting of 223,124,419 people shows no correlation between the proportion of Ethiopians and poverty level in the United States with a correlation coefficient (R) of 0.021 and weighted average of 12.2%. Similarly, the statistical analysis conducted on geographies consisting of 178,904,952 people shows a substantial positive correlation between the proportion of Immigrants from Morocco and poverty level in the United States with a correlation coefficient (R) of 0.564 and weighted average of 12.4%, a difference of 1.5%.
Poverty Correlation Summary
| Measurement | Ethiopian | Immigrants from Morocco |
| Minimum | 1.3% | 1.1% |
| Maximum | 28.9% | 41.6% |
| Range | 27.7% | 40.5% |
| Mean | 11.5% | 12.9% |
| Median | 11.3% | 11.1% |
| Interquartile 25% (IQ1) | 9.2% | 8.4% |
| Interquartile 75% (IQ3) | 13.1% | 13.8% |
| Interquartile Range (IQR) | 3.9% | 5.4% |
| Standard Deviation (Sample) | 5.0% | 8.0% |
| Standard Deviation (Population) | 4.9% | 7.9% |
Demographics Similar to Ethiopians and Immigrants from Morocco by Poverty
In terms of poverty, the demographic groups most similar to Ethiopians are Immigrants from Fiji (12.2%, a difference of 0.010%), Immigrants from Ethiopia (12.2%, a difference of 0.050%), Colombian (12.2%, a difference of 0.12%), Immigrants from Nepal (12.2%, a difference of 0.13%), and Immigrants from Albania (12.2%, a difference of 0.13%). Similarly, the demographic groups most similar to Immigrants from Morocco are Mongolian (12.4%, a difference of 0.040%), Uruguayan (12.4%, a difference of 0.060%), Immigrants from Syria (12.3%, a difference of 0.33%), Immigrants from Colombia (12.3%, a difference of 0.36%), and South American (12.3%, a difference of 0.45%).
| Demographics | Rating | Rank | Poverty |
| Immigrants | Nepal | 60.4 /100 | #160 | Good 12.2% |
| Immigrants | Fiji | 59.1 /100 | #161 | Average 12.2% |
| Ethiopians | 59.1 /100 | #162 | Average 12.2% |
| Immigrants | Ethiopia | 58.6 /100 | #163 | Average 12.2% |
| Colombians | 57.8 /100 | #164 | Average 12.2% |
| Immigrants | Albania | 57.7 /100 | #165 | Average 12.2% |
| Venezuelans | 56.9 /100 | #166 | Average 12.2% |
| Immigrants | Chile | 56.7 /100 | #167 | Average 12.2% |
| Immigrants | Venezuela | 56.5 /100 | #168 | Average 12.2% |
| Whites/Caucasians | 55.4 /100 | #169 | Average 12.3% |
| Immigrants | Oceania | 54.6 /100 | #170 | Average 12.3% |
| Immigrants | Spain | 51.3 /100 | #171 | Average 12.3% |
| Immigrants | Portugal | 50.5 /100 | #172 | Average 12.3% |
| Celtics | 50.1 /100 | #173 | Average 12.3% |
| Lebanese | 50.0 /100 | #174 | Average 12.3% |
| South Americans | 48.7 /100 | #175 | Average 12.3% |
| Immigrants | Colombia | 47.7 /100 | #176 | Average 12.3% |
| Immigrants | Syria | 47.5 /100 | #177 | Average 12.3% |
| Uruguayans | 44.7 /100 | #178 | Average 12.4% |
| Immigrants | Morocco | 44.0 /100 | #179 | Average 12.4% |
| Mongolians | 43.6 /100 | #180 | Average 12.4% |