Ethiopian vs French Poverty
COMPARE
Ethiopian
French
Poverty
Poverty Comparison
Ethiopians
French
12.2%
POVERTY
59.1/ 100
METRIC RATING
162nd/ 347
METRIC RANK
11.8%
POVERTY
86.1/ 100
METRIC RATING
131st/ 347
METRIC RANK
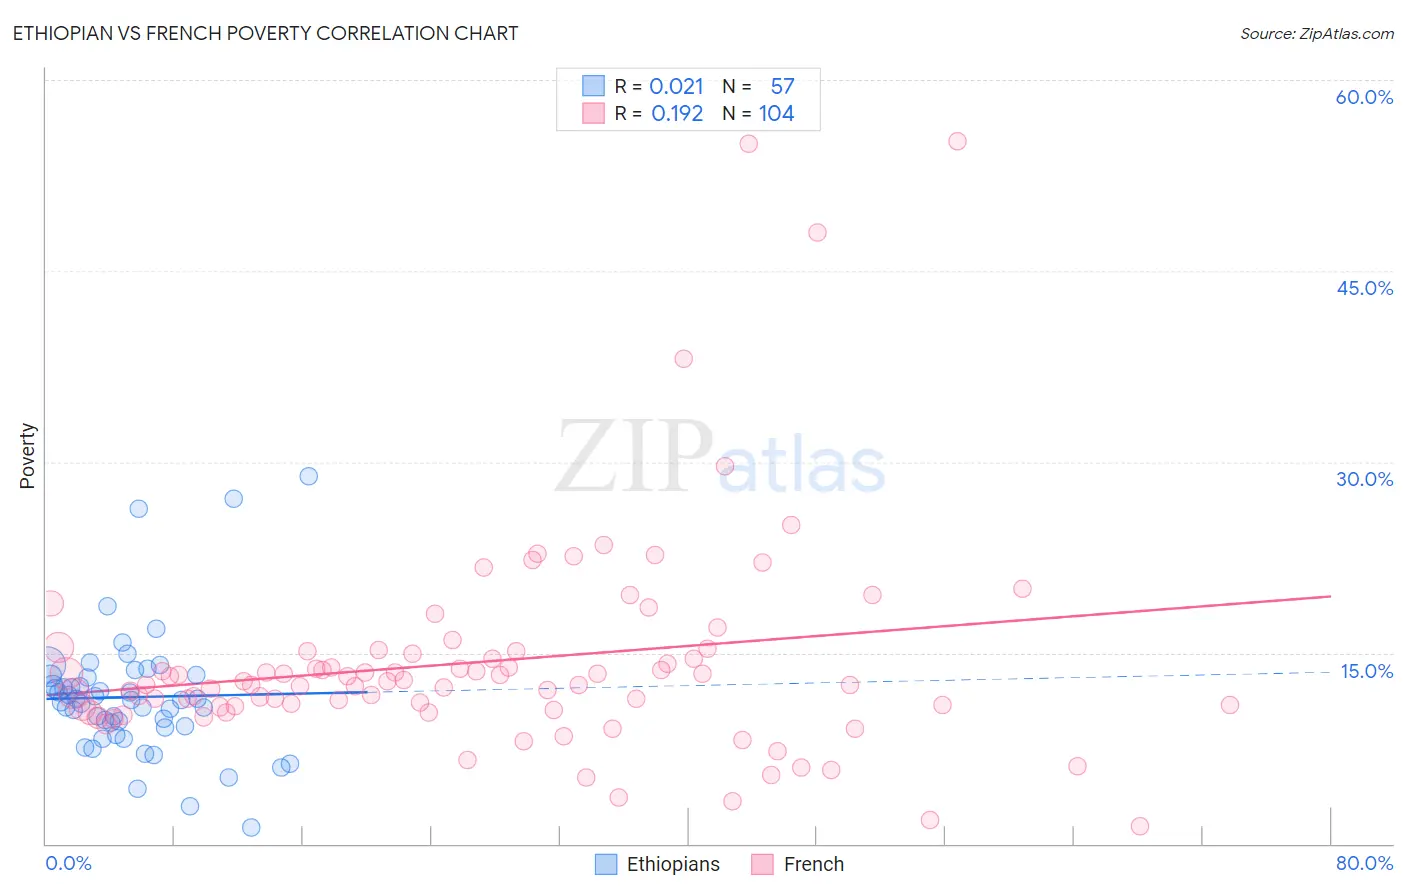
Ethiopian vs French Poverty Correlation Chart
The statistical analysis conducted on geographies consisting of 223,124,419 people shows no correlation between the proportion of Ethiopians and poverty level in the United States with a correlation coefficient (R) of 0.021 and weighted average of 12.2%. Similarly, the statistical analysis conducted on geographies consisting of 571,552,605 people shows a poor positive correlation between the proportion of French and poverty level in the United States with a correlation coefficient (R) of 0.192 and weighted average of 11.8%, a difference of 3.7%.
Poverty Correlation Summary
| Measurement | Ethiopian | French |
| Minimum | 1.3% | 1.4% |
| Maximum | 28.9% | 55.2% |
| Range | 27.7% | 53.8% |
| Mean | 11.5% | 14.3% |
| Median | 11.3% | 12.6% |
| Interquartile 25% (IQ1) | 9.2% | 10.7% |
| Interquartile 75% (IQ3) | 13.1% | 15.0% |
| Interquartile Range (IQR) | 3.9% | 4.3% |
| Standard Deviation (Sample) | 5.0% | 8.6% |
| Standard Deviation (Population) | 4.9% | 8.5% |
Similar Demographics by Poverty
Demographics Similar to Ethiopians by Poverty
In terms of poverty, the demographic groups most similar to Ethiopians are Immigrants from Fiji (12.2%, a difference of 0.010%), Immigrants from Ethiopia (12.2%, a difference of 0.050%), Colombian (12.2%, a difference of 0.12%), Immigrants from Nepal (12.2%, a difference of 0.13%), and Immigrants from Albania (12.2%, a difference of 0.13%).
| Demographics | Rating | Rank | Poverty |
| Hungarians | 63.6 /100 | #155 | Good 12.2% |
| Scotch-Irish | 62.6 /100 | #156 | Good 12.2% |
| Costa Ricans | 62.2 /100 | #157 | Good 12.2% |
| Taiwanese | 61.8 /100 | #158 | Good 12.2% |
| Pennsylvania Germans | 60.8 /100 | #159 | Good 12.2% |
| Immigrants | Nepal | 60.4 /100 | #160 | Good 12.2% |
| Immigrants | Fiji | 59.1 /100 | #161 | Average 12.2% |
| Ethiopians | 59.1 /100 | #162 | Average 12.2% |
| Immigrants | Ethiopia | 58.6 /100 | #163 | Average 12.2% |
| Colombians | 57.8 /100 | #164 | Average 12.2% |
| Immigrants | Albania | 57.7 /100 | #165 | Average 12.2% |
| Venezuelans | 56.9 /100 | #166 | Average 12.2% |
| Immigrants | Chile | 56.7 /100 | #167 | Average 12.2% |
| Immigrants | Venezuela | 56.5 /100 | #168 | Average 12.2% |
| Whites/Caucasians | 55.4 /100 | #169 | Average 12.3% |
Demographics Similar to French by Poverty
In terms of poverty, the demographic groups most similar to French are Immigrants from Ukraine (11.8%, a difference of 0.10%), Peruvian (11.8%, a difference of 0.11%), South African (11.7%, a difference of 0.19%), Immigrants from Western Europe (11.8%, a difference of 0.19%), and Yugoslavian (11.8%, a difference of 0.19%).
| Demographics | Rating | Rank | Poverty |
| Soviet Union | 88.4 /100 | #124 | Excellent 11.7% |
| Immigrants | Brazil | 88.2 /100 | #125 | Excellent 11.7% |
| Immigrants | Norway | 88.0 /100 | #126 | Excellent 11.7% |
| Immigrants | Argentina | 88.0 /100 | #127 | Excellent 11.7% |
| Immigrants | Israel | 87.4 /100 | #128 | Excellent 11.7% |
| South Africans | 87.0 /100 | #129 | Excellent 11.7% |
| Immigrants | Ukraine | 86.6 /100 | #130 | Excellent 11.8% |
| French | 86.1 /100 | #131 | Excellent 11.8% |
| Peruvians | 85.6 /100 | #132 | Excellent 11.8% |
| Immigrants | Western Europe | 85.2 /100 | #133 | Excellent 11.8% |
| Yugoslavians | 85.2 /100 | #134 | Excellent 11.8% |
| Immigrants | Vietnam | 85.2 /100 | #135 | Excellent 11.8% |
| Chileans | 84.2 /100 | #136 | Excellent 11.8% |
| Immigrants | Switzerland | 83.0 /100 | #137 | Excellent 11.8% |
| Immigrants | Jordan | 82.4 /100 | #138 | Excellent 11.9% |